Table of Contents
DORA Metrics Dashboard in LinearB
Monitor your software delivery performance with LinearB’s DORA Metrics Dashboard, tracking Cycle Time, Deployment Frequency, MTTR, and Change Failure Rate to optimize DevOps efficiency.
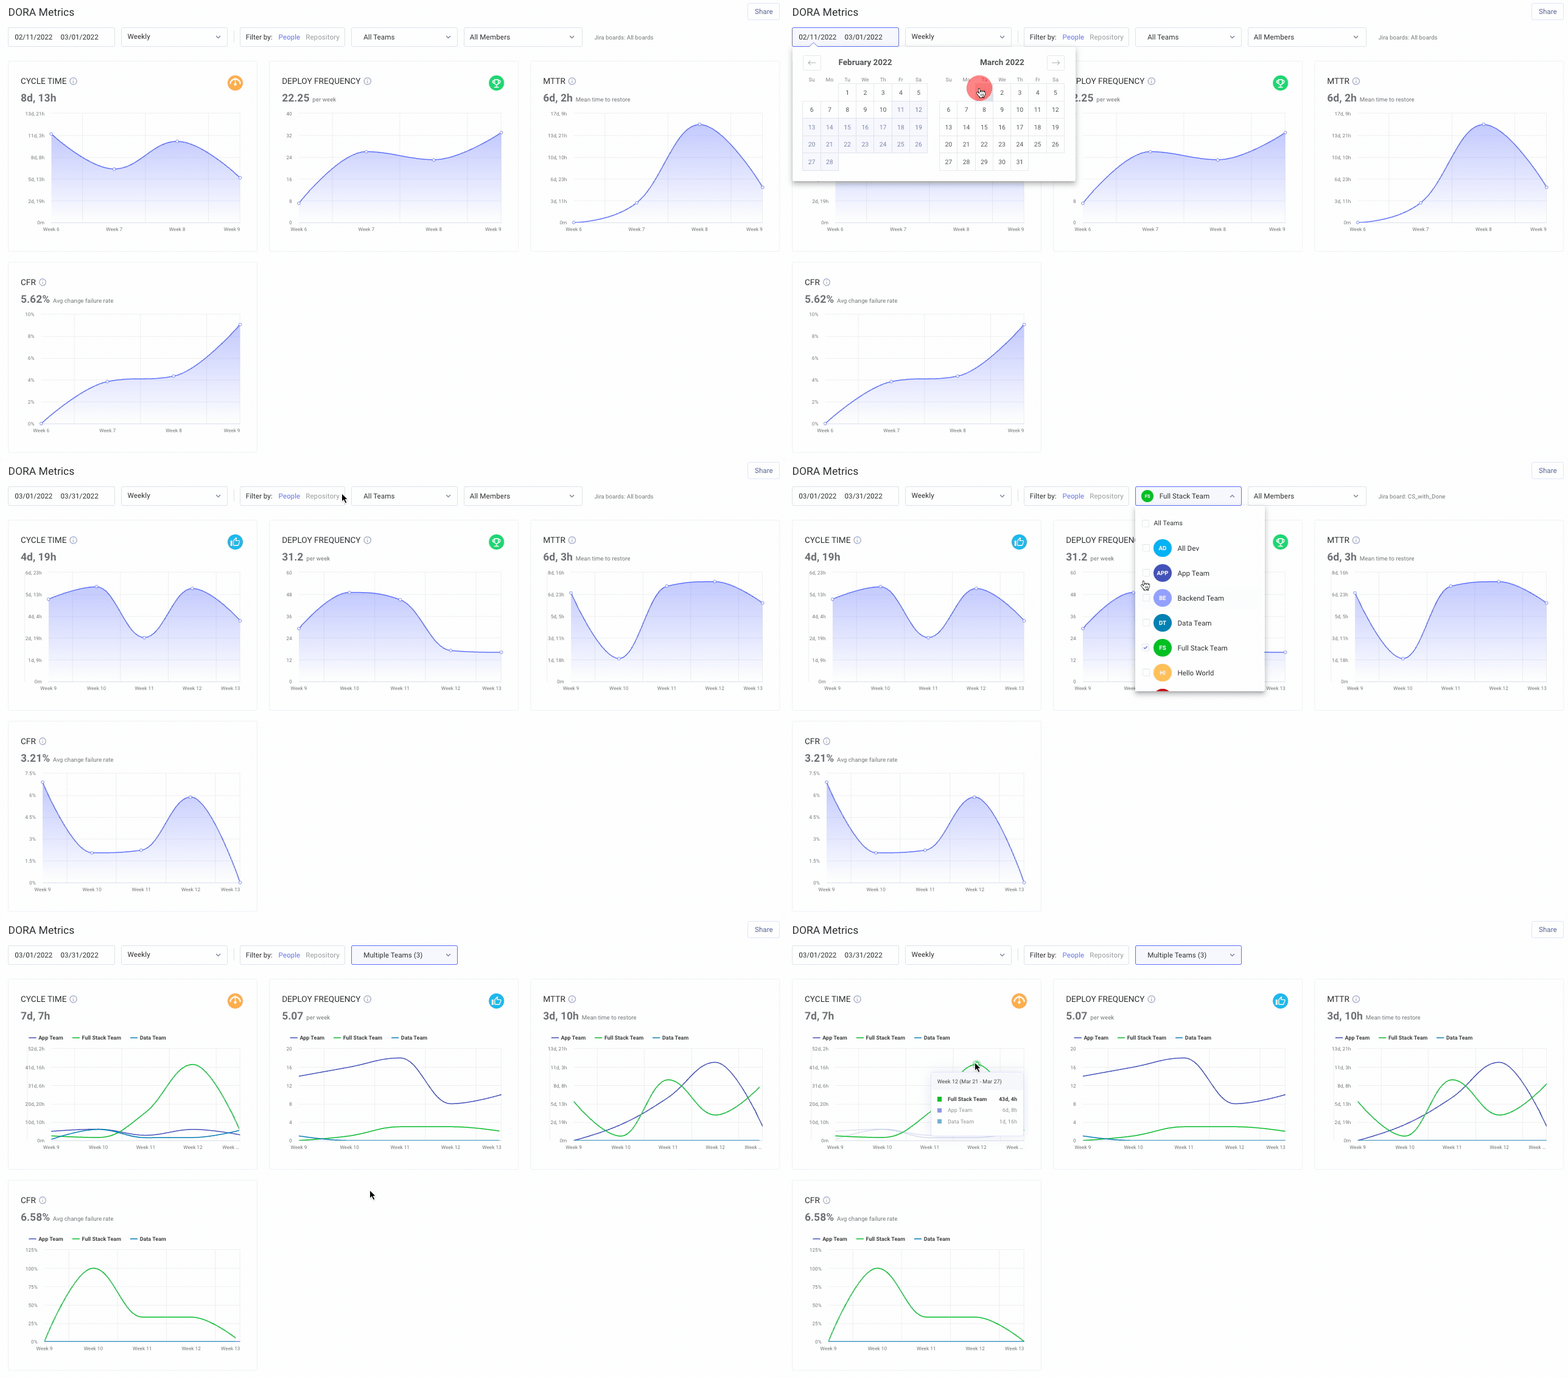
All four of your DORA metrics are available for reporting in the DORA Metrics dashboard. To find this dashboard, go to the Metrics tab, and select "Dora Metrics" from the left menu of available dashboards.
The DORA Metrics Dashboard in LinearB provides real-time insights into four key DevOps performance indicators: Cycle Time, Deployment Frequency, Mean Time to Restore (MTTR), and Change Failure Rate (CFR). These metrics help teams assess engineering efficiency, deployment stability, and system reliability over time.
Accessing the DORA Metrics Dashboard
To access the DORA Metrics Dashboard:
- Navigate to the Metrics tab.
- Select "DORA Metrics" from the left menu.
This dashboard allows you to filter data by:
- Date range – View performance over a specific period.
- Teams – Analyze one or multiple teams at once.
- Repositories – Focus on performance across specific codebases.
Filters are saved automatically between visits, making it easy to track long-term trends.


Understanding DORA Metrics
1. Cycle Time
- Measures the average time from first commit to deployment.
- Data is displayed per day, week, or month for trend analysis.
- Only completed branches are included—branches still in progress are excluded.
- Click any data point to view a breakdown of contributing repositories.

2. Deployment Frequency
- Tracks how often code is successfully deployed to production.
- Calculated by counting releases from your Git provider (via tags, merges, or API deployments).
- LinearB divides the number of releases by the selected timeframe (days, weeks, or months).

3. Mean Time to Restore (MTTR)
- Measures the average time to recover from a system failure.
- Calculated from the moment a "production bug" is logged in your Project Management (PM) tool to when it is resolved.
- Customizable – Define what counts as a critical issue by modifying your MTTR settings.
- Haven't connected your PM tool? Connect LinearB to a PM platform

4. Change Failure Rate (CFR)
- Measures the percentage of deployments that cause production failures.
- LinearB calculates this by dividing the number of "production incidents" logged in your PM tool by the number of deployments.
- Customizable – Define what constitutes a failure event in the CFR settings.
- PM tool not connected? Set up PM tool integration

Creating Custom DORA Reports
For more granular insights, you can:
- Create custom reports with additional metrics and filters.
- Customize graph colors and adjust report layouts.
- Save reports for future team-wide tracking.
🔗 Learn how to build a custom metrics dashboard
Why Use the DORA Metrics Dashboard?
- Track DevOps efficiency in real time.
- Identify bottlenecks in your deployment process.
- Improve response times for production failures.
- Optimize team performance with data-driven insights.
By leveraging DORA Metrics in LinearB, teams can drive continuous improvement, enhance deployment reliability, and align with industry best practices. 
Related Resources
How did we do?
Building Custom Metrics Reports in LinearB
Investment Strategy Dashboard in LinearB