Table of Contents
Building a Metrics Dashboard in LinearB
Create custom LinearB metrics dashboards to track team performance, monitor key engineering KPIs, and visualize development workflows with flexible filters, widgets, and reporting options.
Updated
by Steven Silverstone
Creating custom dashboards in LinearB allows you to track team, individual, or repository-level metrics with ease. You can build multiple dashboards, configure them to suit your needs, and choose whether to keep them private or share them with your team.
Creating a Custom Dashboard
- Open the Metrics Page
- Click the
 icon in the top-left corner of the Metrics page.
- Click the
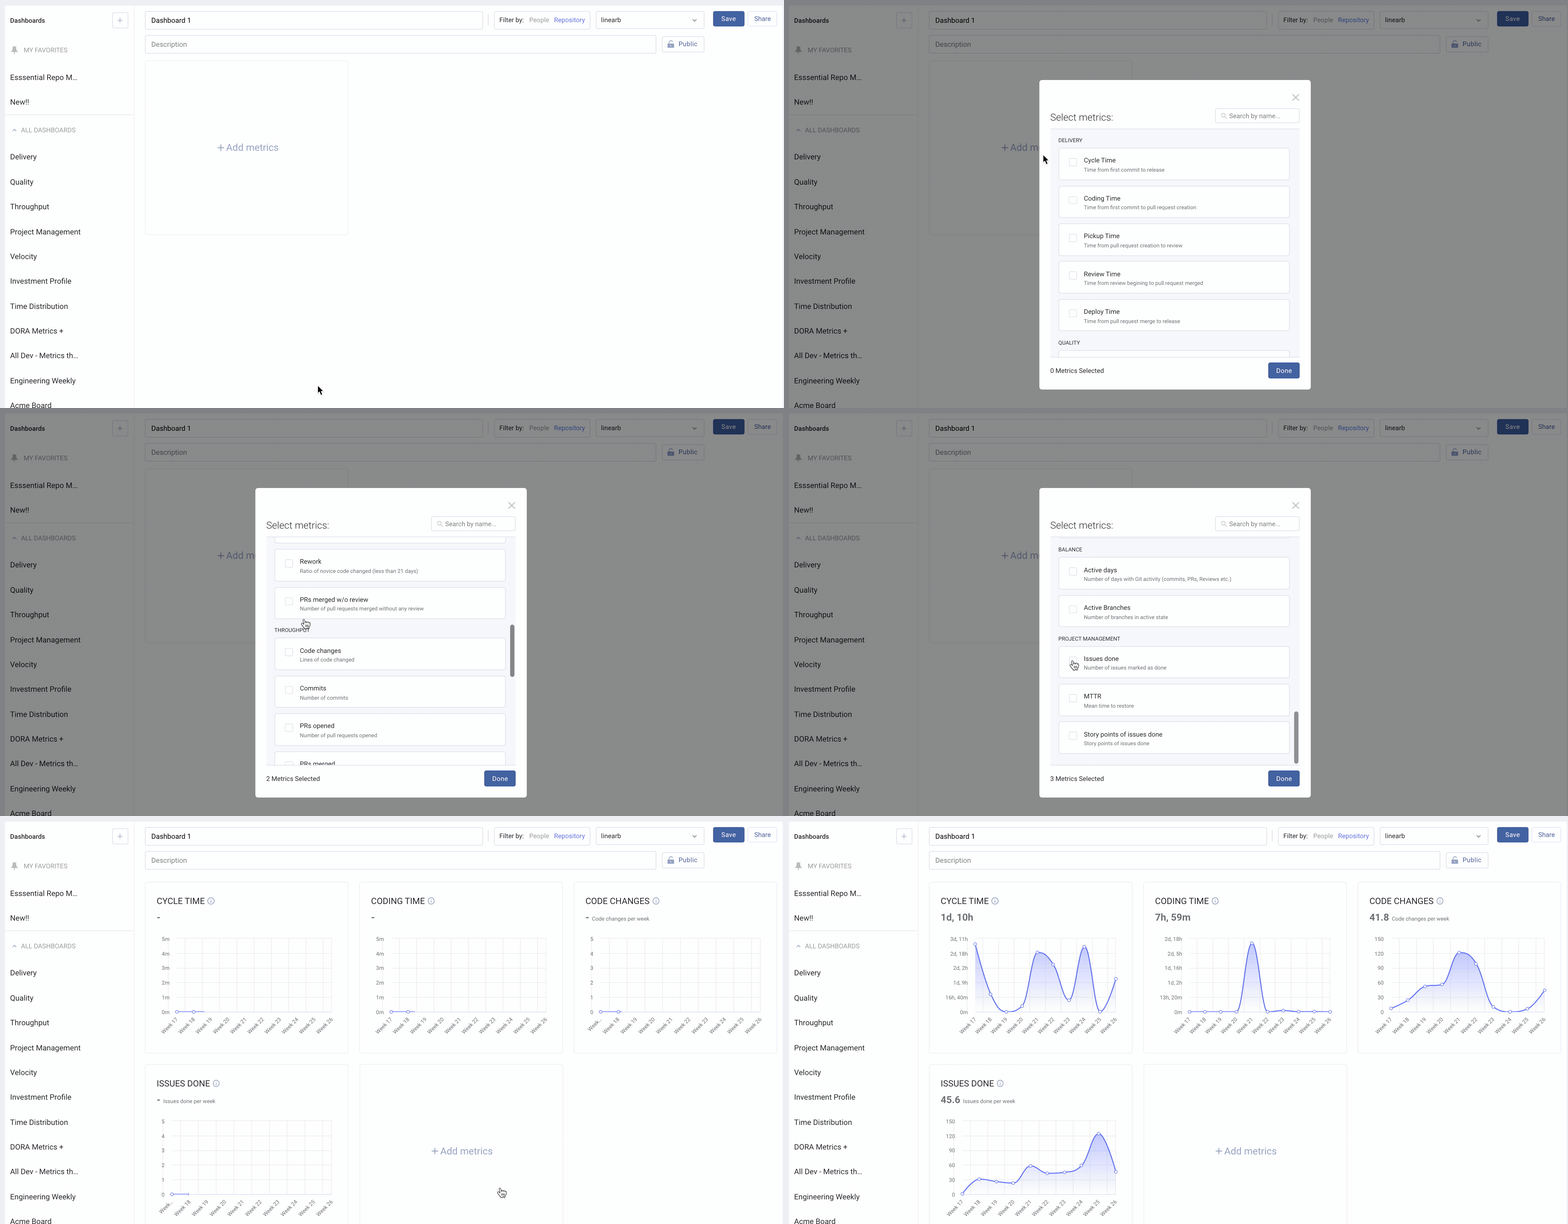
- Name Your Dashboard
- Choose a clear, descriptive name that reflects the focus of the dashboard.
- Add a Description
- When you hover over the dashboard title, this description will be visible for quick reference.
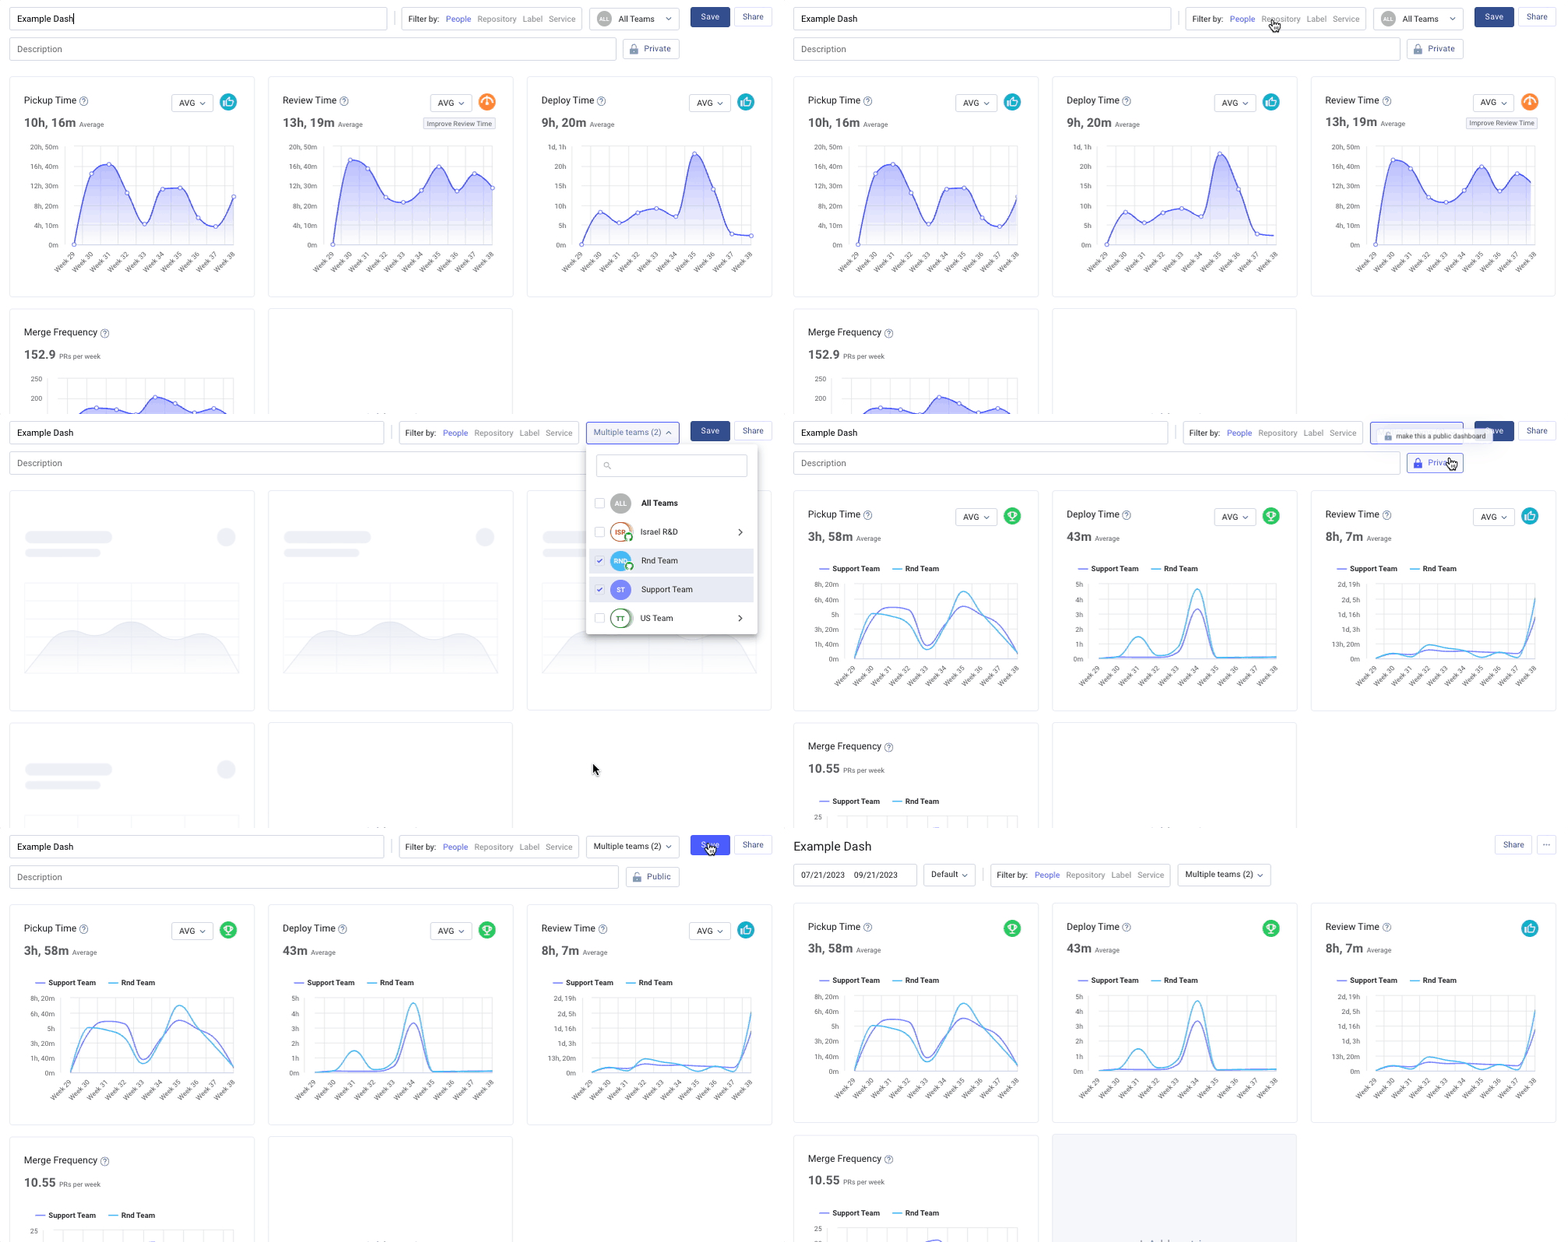
- Apply Filters
- Dashboards can focus on teams, individual developers, or Git repositories.
- Team(s): Select one or more teams. 🔗 Learn more about multi-team dashboards
- People: Create a dashboard that tracks metrics for an individual developer (useful for 1:1 meetings).
- Repositories: Select a specific repo to monitor. (Add more repos via Company Settings > Git > Add Repositories.)
- Set Dashboard Visibility
- Click the lock icon to keep the dashboard private or make it public for other users in your account.
- Add Metrics
- Click +Add Metrics, select the relevant metrics, and click Save


Customizing Your Dashboard
Rearrange Widgets
- Drag & drop widgets to reorder them as needed.


Select Specific Teams
- Use the teams dropdown to display up to six teams on the dashboard.
Filter by Repo, Label, or Service
- Focus on specific repositories, labels, or services instead of entire teams.
Duplicate Dashboards
- Quickly create template-based dashboards for focused reports.
- Click Save As to copy an existing dashboard and apply modifications.
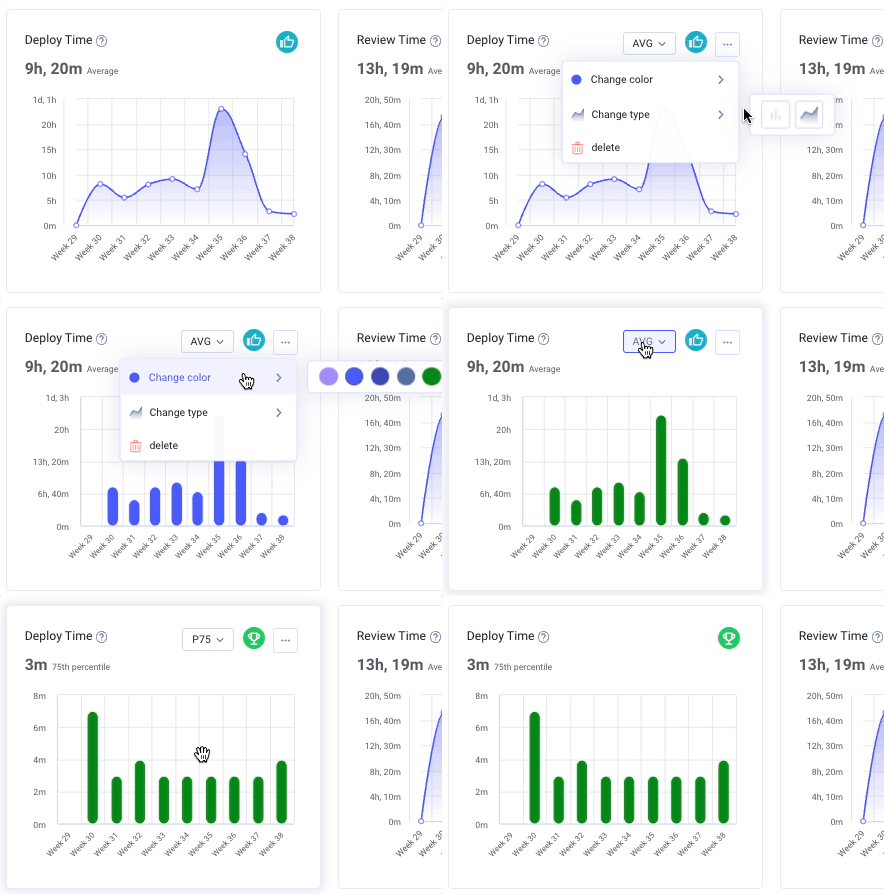
Adjust Data Display
- Change from Average to Percentile: Click the dropdown on any widget to switch between:
- Average
- P75 (75th Percentile)
- P50 (50th Percentile/Median)
- Modify Chart Appearance:
- Change colors using the color selection
 button
 - Switch between line charts and bar charts
 for better visualization.
- Change colors using the color selection

Available Metrics:
Delivery Metrics
- Cycle Time: Measure the average time it takes for a branch to move from first commit to release.
- Coding Time: Time from first commit to pull request creation.
- Pickup Time: Time from pull request creation to review.
- Review Time: Time from review beginning to pull request merged
- Deploy Time: Time from pull request merge to release
- Time to approve: Time from review beginning to pull request first approval
- Time to merge: Time from pull request first approval to pull request merged
Quality Metrics
- PR Size: Size of pull request (total lines of code changed)
- Review Depth: Avg. number of comments per review
- New Code: Ratio of new code
- Refactor: Ratio of legacy code changed (more than 21 days)
- Rework: Ratio of novice code changed (less than 21 days)
- PRs Merged Without Review: Number of pull requests merged without any review
Throughput Metrics
- Code Changes: Lines of code changed in the period
- Commits: Number of commits in the period
- PRs Opened: Number of pull requests opened
- PRs Merged: Number of pull requests merged
- Merge Frequency: Number of pull requests merged
- Reviews: Number of pull requests reviews
- Deploy Frequency: Average releases per day
- Done Branches: Number of branches moved to state Merged or Released
- Coding Days*: A normalized count of developer-days-with-code over a period.
- It sums, per day, the fraction of the team that committed code at least once.
Balance Metrics
- Active Days: Number of days with Git activity (commits, PRs, Reviews etc.)
- Active Branches: Number of branches in active state
Project Management Metrics
- MTTR: Mean time to restore
- CFR: Change failure rate

Maximizing Dashboard Efficiency
- Use public dashboards for team-wide visibility.
- Leverage templates to quickly replicate useful configurations.
- Customize charts and filters to focus on the most relevant insights for your team.
By setting up a custom LinearB metrics dashboard, you can monitor key performance indicators (KPIs), optimize development workflows, and drive continuous improvement across your engineering teams.

Related Resources
How did we do?
Building Custom Metrics Reports in LinearB
DORA Metrics Dashboard in LinearB