Table of Contents
Investment Strategy Dashboard in LinearB
Track how engineering resources are allocated with LinearB’s Investment Strategy Dashboard, ensuring alignment between development efforts and business priorities.

Investment Strategy of Project Management Tickets
This report tracks the time spent on each issue type across a single iteration or multiple iterations, providing a clear view of how engineering efforts are distributed.
The Investment Strategy Dashboard is a key component of engineering metrics, linking development work to business value. It highlights the percentage of total iteration time dedicated to different types of work, helping teams align their efforts with strategic priorities. This data is especially valuable for communicating with non-technical leadership, ensuring transparency in how engineering resources are allocated and confirming that development priorities support the organization's overall direction.
Accessing the Investment Strategy Dashboard
To view the Investment Strategy Dashboard:
- Navigate to the Metrics tab.
- Select "Investment Profile" from the left-hand menu.
This report can be filtered by:
- Team – Analyze how different teams allocate their engineering efforts.
- Project Management Board – View data based on specific Jira or Shortcut boards.
- Issue Type – Measure the percentage of time spent on different categories of work.
Filtering preferences are saved automatically, making it easy to track investment trends over time.
Understanding Investment Strategy Data
1. What the Report Measures
- Tracks the time spent on each issue type across a selected iteration or multiple iterations.
- Displays the percentage of total engineering time allocated to different categories of work.
- Helps non-technical stakeholders understand how engineering resources are utilized.
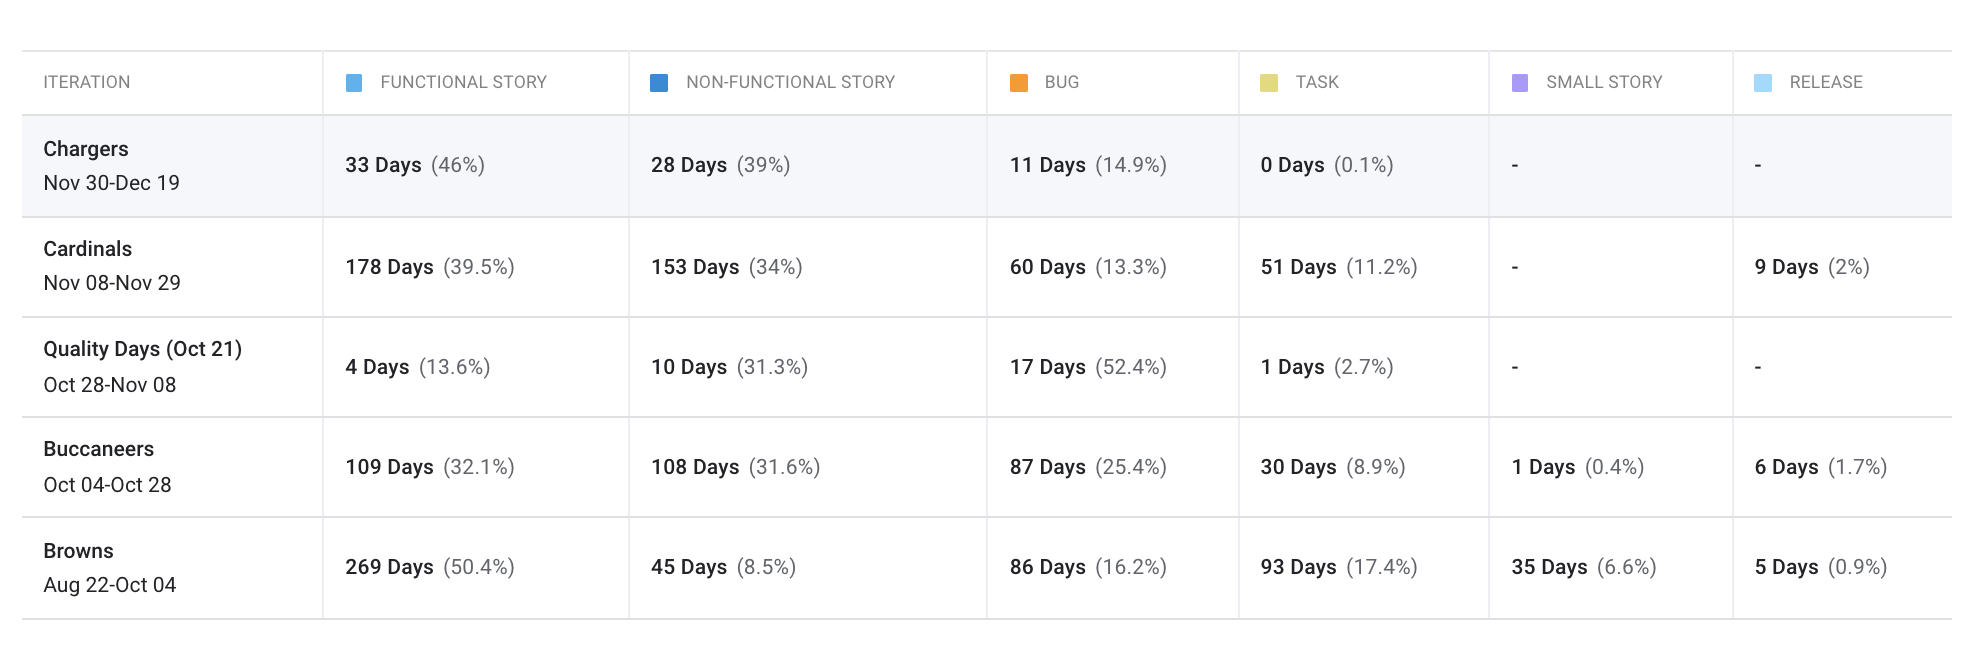

2. Data Breakdown
The table below the graph provides:
- A detailed breakdown of time spent on each issue type.
- The percentage of the total iteration time dedicated to each category.

3. How Time is Measured
- Time tracking starts when an issue is moved to "In Progress".
- Time tracking ends when an issue is marked as "Done".
- Only completed issues are included in the report to ensure accuracy.
🔗 Learn more about understanding metrics dashboards
Why Use the Investment Strategy Dashboard?
- Align engineering work with business goals – Ensure time is spent on the right priorities.
- Improve communication with leadership – Provide clear insights into engineering resource allocation.
- Identify imbalances in workload – Adjust team priorities based on actual time investment.
By leveraging LinearB’s Investment Profile Dashboard, teams can make informed decisions about resource allocation, optimize engineering efficiency, and ensure alignment with business strategy.

Related Resources
How did we do?
Dashboards & Reporting
Metrics Inspection in LinearB