Table of Contents
LinearB Engineering Metrics Benchmarks
The LinearB Engineering Metrics Benchmarks were created from a study of 3,694,690 pull requests from 2,022 dev organizations, spanning over 103,807 active contributors.

Introduction to Community Benchmarks
LinearB community benchmarks help engineering teams compare their performance against data-backed software engineering benchmarks. The 2026 benchmarks are based on a study of more than 8.1 million pull requests from 4,813 teams and 163,820 active contributors across 42 countries.
For the latest methodology, benchmark report, and supporting resources, see Engineering Metrics Benchmarks.

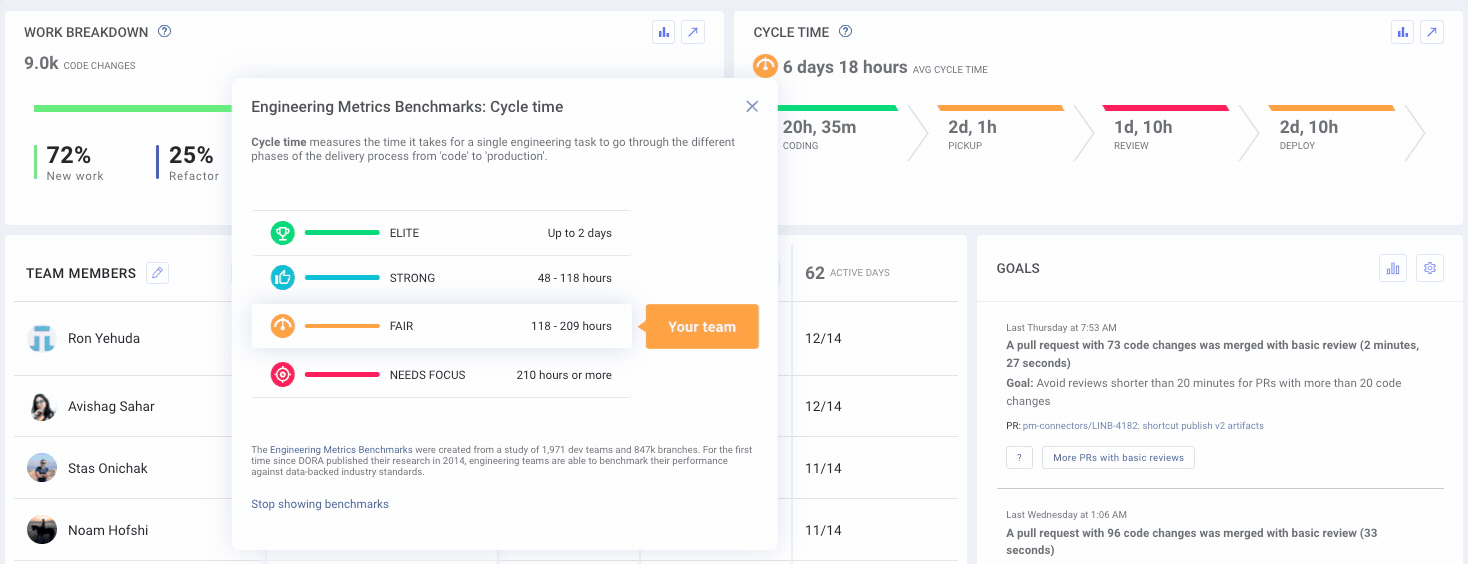
Understanding Benchmark Categories
LinearB categorizes benchmark performance into four tiers:
Category |
Performance Level |
Elite |
Top 10% of included organizations. |
Good |
Top 30% of included organizations. |
Fair |
Top 60% of included organizations. |
Needs focus |
Bottom 40% of included organizations. |
Metric |
Elite |
Good |
Fair |
Needs focus |
Coding Time Hours |
< 54 mins |
54 mins - 4 hours |
5 - 23 |
> 23 |
Pickup Time Hours |
< 1 |
1 - 4 |
5 - 16 |
> 16 |
Approve Time Hours |
< 10 |
10 - 22 |
23 - 42 |
> 42 |
Merge Time Hours |
< 1 |
1 - 3 |
4 - 16 |
> 16 |
Review Time Hours |
< 3 |
3 - 14 |
15 - 24 |
> 24 |
Deploy Time Hours |
< 16 |
16 - 106 |
107 - 277 |
> 277 |
Cycle Time Hours |
< 25 |
25 - 72 |
73 - 161 |
> 161 |
Merge Frequency Per developer/week |
> 2.0 |
2.0 - 1.2 |
1.2 - 0.66 |
< 0.66 |
Deploy Frequency Per service |
> 1.2 |
1.2 - 0.5 |
0.5 - 0.2 |
< 0.2 |
PR Size Code changes |
< 100 |
100 - 155 |
156 - 228 |
> 228 |
PR Maturity Percentage |
> 89% |
89 - 83% |
82 - 77% |
< 77% |
Change Failure Rate Percentage |
< 1% |
1 - 4% |
5 - 17% |
> 17% |
Refactor Rate Percentage |
< 11% |
11 - 16% |
17 - 22% |
> 22% |
Rework Rate Percentage |
< 3% |
3 - 5% |
6 - 8% |
> 8% |

Understanding Percentiles in Benchmarking
The 2026 Software Engineering Benchmarks Report uses p75 aggregation. This helps reduce the impact of extreme outliers and provides a more reliable benchmark for comparison across organizations.
75th Percentile Calculation
- 75% of values are below the p75 threshold.
- 25% of values are above the p75 threshold.
Customizing Metric Settings
You can configure your LinearB instance to report selected metrics using average, median, or percentile-based calculations.
To adjust these settings, go to your Account Settings and select your preferred reporting method. For more information, see Changing your metrics from average to median or percentile.

Viewing Benchmarks in LinearB
LinearB benchmark indicators help teams assess their performance against community benchmarks. These benchmarks are displayed in team dashboards and metrics reports, helping teams understand where they are performing well and where additional focus may be needed.
Dashboard View
- When benchmarks are enabled, a benchmark icon appears next to supported metrics on the team dashboard.
- This allows teams to quickly compare their performance against LinearB benchmark standards.
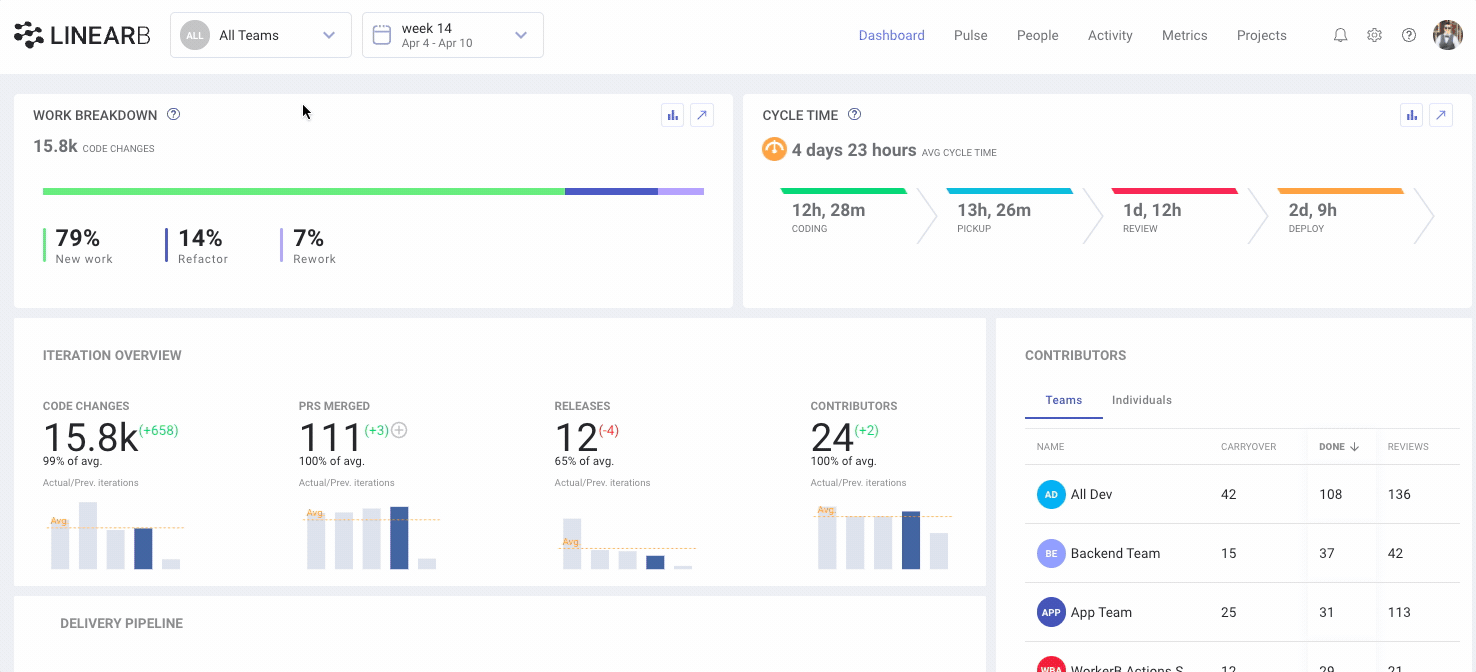
Metrics Report View
- The Metrics Report provides a detailed breakdown of how a team performs against benchmarked metrics.
- Multiple teams can be combined in a metrics dashboard to compare performance across teams.
LinearB benchmarks are available for the following key engineering metrics:
- Cycle Time
- Coding Time
- Pickup Time
- Approve Time
- Merge Time
- Review Time
- Deploy Time
- Deploy Frequency
- Merge Frequency
- PR Size
- PR Maturity
- Rework Rate
- Refactor Rate
- Change Failure Rate

Enabling or Disabling Benchmarks
Benchmarks may not be relevant for every team. If needed, you can disable benchmark indicators for a specific team.
- Navigate to Team Settings > General.
- Toggle Engineering Metrics Benchmarks off.
- Click Save.
Use benchmarks to identify areas for improvement, compare team performance against community standards, and focus optimization efforts where they can have the greatest impact.
How did we do?
Benchmarks