Table of Contents
Velocity Dashboard in LinearB
Monitor sprint performance with LinearB’s Velocity Dashboard, tracking completed tasks by issue type to improve workload distribution and sprint planning.

The Velocity Dashboard in LinearB provides a detailed breakdown of completed tasks within an iteration, categorized by issue type in Jira or Shortcut. This report helps teams understand how much work is being completed each sprint, and can be used alongside the Investment Profile Dashboard to compare task volume against time investment.
Accessing the Velocity Dashboard
To view the Velocity Dashboard:
- Navigate to the Metrics tab.
- Select "Velocity" from the left-hand menu.
This report can be filtered by:
- Team – View completed work at the team level.
- Project Management Board – Analyze specific Jira or Shortcut boards.
- Issue Type – Track progress based on different task categories.
Filters are automatically saved, allowing teams to track velocity trends over multiple sprints.

Understanding the Velocity Report
1. What the Report Measures
- Tracks the number of tickets completed per iteration, grouped by issue type.
- Provides insights into sprint execution and workload distribution.
- Helps teams assess whether work is evenly distributed or overloaded.
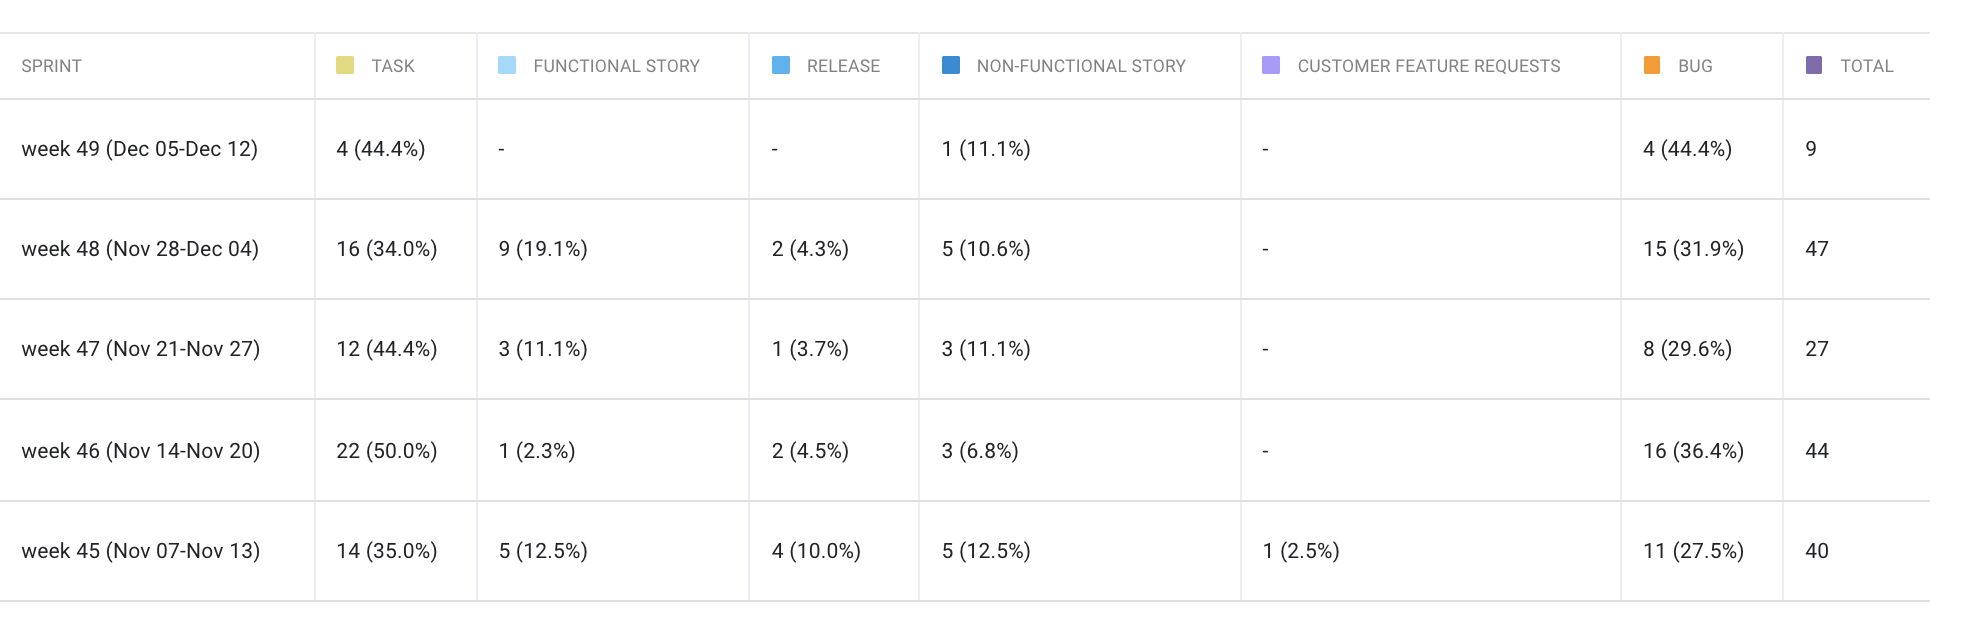
2. Data Breakdown
The table below the graph provides:
- The total number of completed tickets per issue type.
- The percentage of total work attributed to each issue type.
3. Workflow Considerations
- Only tickets marked as "Done" during the iteration are included.
- Tickets still in progress will not appear in the report.
🔗 Learn more about metrics dashboards

Why Use the Velocity Dashboard?
- Track team productivity – Measure how many tasks are completed per sprint.
- Compare task volume to time investment – Use alongside the Investment Profile Dashboard for better workload insights.
- Identify inefficiencies – Spot trends in completed work to balance workloads and improve planning.
By leveraging LinearB’s Velocity Dashboard, teams can optimize sprint planning, track execution trends, and improve overall development efficiency. 
Related Resources
🔗 DORA Metrics Dashboard in LinearB
How did we do?
Using PR Label Filters in Metrics Reports