Table of Contents
Time Distribution Dashboard in LinearB
Analyze workflow efficiency with LinearB’s Time Distribution Dashboard, tracking how long tickets stay in progress to optimize sprint planning and reduce bottlenecks.

The Time Distribution Dashboard in LinearB provides insights into how long project management tickets remain in different workflow stages during an iteration or sprint. By analyzing this data, teams can identify bottlenecks, inefficiencies, and process delays, leading to better workflow optimization.

Accessing the Time Distribution Dashboard
To view the Time Distribution Dashboard:
- Navigate to the Metrics tab.
- Select "Time Distribution" from the left-hand menu.
This report can be filtered by:
- Team – Analyze ticket progression within specific teams.
- Project Management Board – View time distribution for Jira or Shortcut boards.
- Issue Type – Measure the time spent on different categories of work.
Filtering preferences are saved automatically, allowing for easy comparison across different time periods.
Understanding Time Distribution Data
1. What the Report Measures
- Tracks the average time tickets spend in each workflow stage over a week or sprint.
- Similar to Cycle Time metrics, but focuses exclusively on Jira-based data.
- Helps teams analyze where tasks slow down in the development lifecycle.
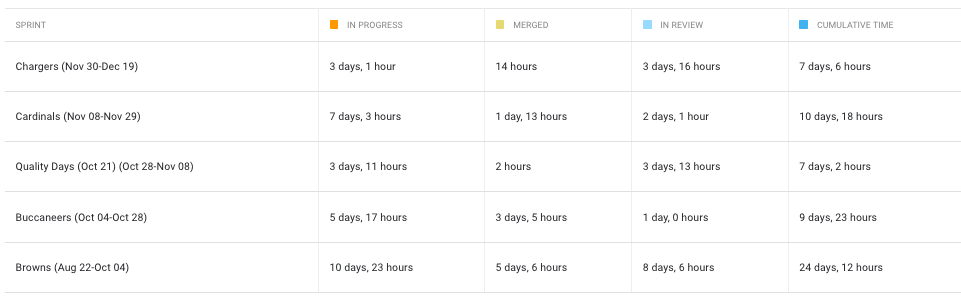
2. Data Breakdown
The table below the graph provides:
- A breakdown of time spent per issue type.
- The percentage of time spent in each workflow stage.
3. Workflow Status Considerations
- Only "In Progress" statuses are included in the report.
- Completed ("Done") statuses are not tracked.
- Since some tickets may still be open, Time Distribution reports can change over time as carryover tickets are closed.
🔗 Learn more about understanding metrics dashboards

Why Use the Time Distribution Dashboard?
- Identify workflow inefficiencies – Detect where tasks get stuck in progress.
- Improve sprint and iteration planning – Allocate resources more effectively.
- Enhance team performance tracking – Use data-driven insights to optimize delivery speed.
By leveraging LinearB’s Time Distribution Dashboard, teams can analyze workflow bottlenecks, refine project management strategies, and accelerate development cycles. 
Related Resources
🔗 LinearB Engineering Metrics Benchmarks
How did we do?
Sharing LinearB Metrics and Projects
Understanding Metrics Dashboards in LinearB