Progress Over Time in LinearB
The Progress Over Time feature in LinearB allows teams to track and measure project execution within a defined scope.

By visualizing progress trends, teams can monitor efficiency, detect scope creep, and improve forecasting.
To use this feature, you must connect Azure Boards or Jira as your project management (PM) tool. If your PM tool is not yet connected, complete that setup first.
Accessing Progress Over Time
- Navigate to the Projects tab in the LinearB Web Application.
- Click on the Forecasting tab.
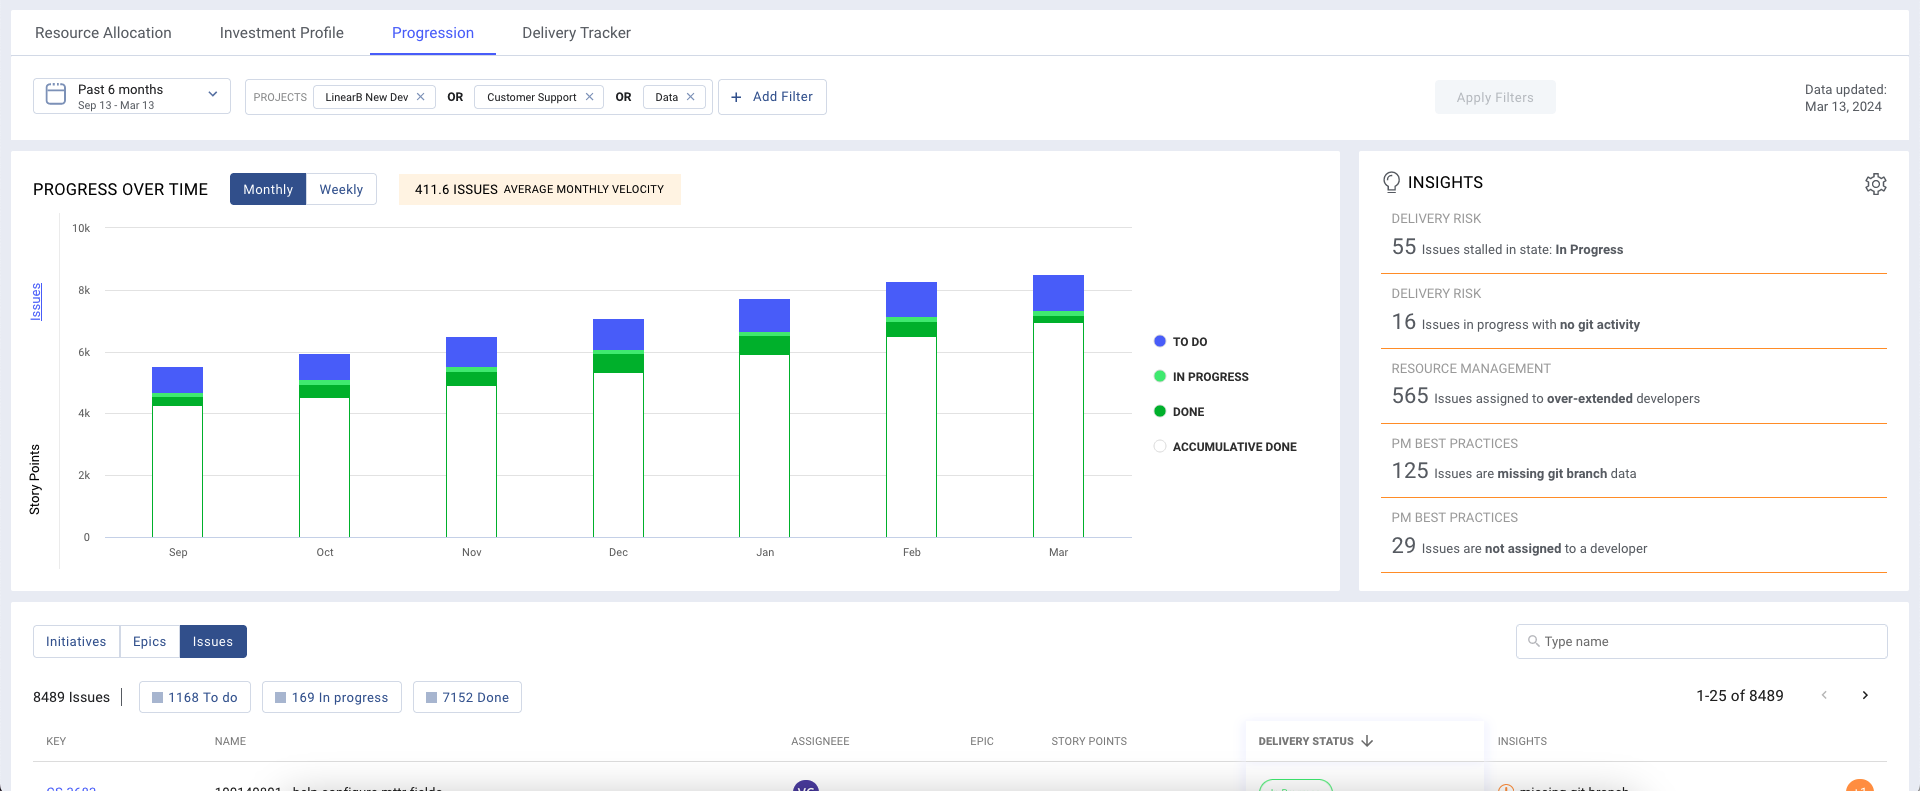
- The Progress Over Time dashboard will appear, displaying project status based on defined filters.

Defining Project Scope
To analyze progress over time, you must configure the scope of the project:
- Set a Time Frame – Use the drop-down menu at the top left to define the period for which data will be displayed.
- Apply Filters – Use AND/OR conditions to refine project tracking. Available filters include:
- For Jira Users:
- Project
- Initiative
- Epic
- Board
- Label
- Fields (Leads to a drop-down of custom fields)
- Custom Fields (If you use custom hierarchies, LinearB will map them to epics, initiatives, or projects.mapped to epics, initiatives, or projects)
- Fix Version
- For Azure DevOps (ADO) Users:
- Project
- Feature
- Epic
- Tag (leads to a drop-down of tags)
- Field (leads to a drop-down of fields)
- For Jira Users:
Once filters are applied, the graph adjusts dynamically to reflect progress within the selected scope.

Understanding the Graph
The Progress Over Time graph provides a detailed breakdown of work status evolution within the defined project scope:
- Consistent Graph Height: Indicates a well-scoped project with stable progress and no unexpected changes.
- Increasing Graph Height: Suggests scope creep, meaning new work is being added continuously, which can lead to project delays.
- Accumulative Done Bar: Ideally, this should grow steadily over time, reflecting completed work and indicating project progress.
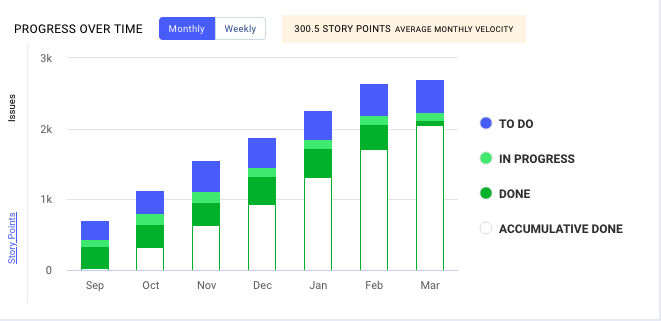
Customization Options
- Switch between Story Points and Issues using the selection panel on the left.
- Toggle statuses on or off by clicking on their respective labels in the graph legend.
- View average velocity (issues or story points completed per week/month) at the top of the graph, which adjusts based on the selected unit.

Using Insights for Actionable Data
The Insights panel highlights key areas for improvement, helping teams identify risks and optimize workflows.
Default Insights:
For driving clear action, you'll want to explore the Insights tab to the right of the graph. Insights will call out notable areas for improvement in the project. By default, we offer these insights:
- Issues stalled in state: In Progress: Tracks issues that have remained in the In Progress state beyond a user-defined threshold (default: 7 days). A high number of stalled issues may indicate project bottlenecks and risks.
- Issues in progress with no git activity: Identifies issues marked as 'In Progress' that have not recorded any Git activity—such as commits, branches, or pull requests—during the selected timeframe. This suggests that no actual development work has been performed on these tasks despite their status, potentially signaling stalled progress. A high number of such issues may indicate inefficiencies in workflow management. To mitigate this, consider enabling WorkerB alerts to notify team members when an issue remains in progress without associated Git activity.: Identifies tasks that are marked as "In Progress" but lack Git activity (such as commits or branches) over the selected timeframe. High numbers suggest possible inefficiencies and warrant investigation.
- Issues assigned to over-extended developers: Highlights developers assigned to more than the recommended number of active Epics (default: 3). Overloading developers can impact efficiency and project timelines.
- Issues are missing git branch data: Detects issues in progress that lack associated branches. If prevalent, consider implementing Git automation tools like gitStream.
- Issues are not assigned to a developer: Flags issues without an assigned developer. Unowned tasks may be overlooked, impacting project delivery.
- Issues without an estimate: Identifies tasks lacking a story point estimate, making workload forecasting difficult. Teams not using story points may opt to disable this insight.
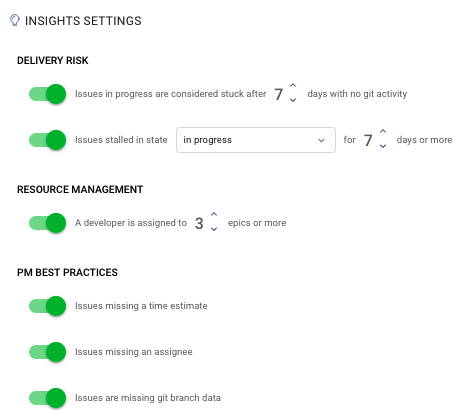
Customizing Insights
- Click the gear icon in the Insights panel to adjust the settings and tailor insights to your project needs.

Individual Initiative/Epic/Issue View
Below the Progress Over Time and Insights views, a detailed list of Initiatives, Epics, or Issues is displayed.
Available Views:
- Issues View: Provides a detailed breakdown of individual tasks.
- Initiatives View: Offers a high-level overview of project progress.
Each entry includes:
- Assignee: The team member responsible for the task.
- Parent Issue: Epics for Issues, Initiatives for Epics, offering hierarchical context.
- Delivery Status: Current state of work (To Do, In Progress, Done).
Filtering Options
You can refine the displayed results by selecting To Do, In Progress, or Done at the top of the list.
Linked Insights
Clicking on an Insight automatically filters the list to show only the affected issues, making it easier to pinpoint and address project risks. By integrating Git and PM tool data, teams can proactively manage their most pressing concerns and ensure smooth project execution.

Data Update Frequency
- Project Data: Updated daily at 4:30 AM UTC.
- Insights Data: Updated every 4 hours (at
x:00andx:30minutes past the hour).

Related Features & Resources
- Project Forecast – Predict project delivery timelines.
- Understanding Project Delivery Trackers – Learn how to track project progress efficiently.
- Using Project Filters – Optimize tracking using tailored filters.
For further assistance, contact support@linearb.io or visit our Help Center.
How did we do?
Forecasting
Project Delivery Tracker