Table of Contents
Cycle Time Metric
This article explains the Cycle Time Metric, which tracks how long it takes code to go from first commit to production. It highlights key stages like coding, review, and deployment to help teams improve efficiency and collaboration.
Updated
by Steven Silverstone
Definition
The Cycle Time Metric is the amount of time it takes for code to go from the first commit to production deployment. Cycle Time includes the following subsets:
- Coding Time: The time it takes from the first commit until a PR is issued, unless Jira-based coding time is being used, in which case it is the time from the linked Jira issue moving to In Progress until a PR is issued. For more information, see Strategies to Identify and Reduce High Coding Time.
- Pickup Time: The time it takes from when a PR is issued until the first review has started. Pickup Time reflects the efficiency of teamwork and often significantly influences overall cycle time, as PRs tend to get delayed during this phase. For more information, see Strategies to Identify and Reduce High Pickup Time.
- Review Time: The time it takes to complete a code review and get a pull request merged.
- Deployment Time:The time it takes to release code to production.

Why is This metric useful?
- This metric is crucial as it highlights the thoroughness of code reviews, which directly influences code quality. It offers insights into the level of collaboration among team members.
By tracking the involvement of a reviewer across multiple review cycles, this metric effectively demonstrates the depth and detail of the feedback provided. This comprehensive view helps ensure that code reviews are both thorough and constructive, leading to more robust and reliable software development outcome.
How to Use it?
- Monitor review activity to ensure a balance between thoroughness and efficiency.

Examples for Context
- Increasing Review Depth results in fewer post-deployment bugs.

Data Sources
- PR review events.

Calculation
- Total number of review-related actions (comments, suggestions, changes requested) in a PR.
- Excluding non-working days from Cycle Time can affect cycle time calculations.

Tunable Configurations
- Weighting specific review types differently.

Benchmarking Guidance
- Effective teams aim for at least 2-3 substantive comments per PR.
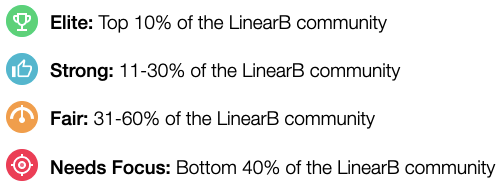
- Once a full cycle time measurement is available, encompassing both coding and deployment times, a badge is displayed next to your cycle time metric. Hover on the badge to compare your team's performance with the LinearB community average.


Error Margins and Limitations
- Overemphasis on comments may delay approvals unnecessarily.

Stakeholder Use Cases
- Reviewers: Ensure meaningful feedback during reviews.
- Managers: Identify PRs with low-quality reviews. Enable WorkerB personal alerts to receive notifications when a review is assigned.
- Team Leads: Encourage your team to assign multiple teammates to a PR.
How did we do?
Cycle Time Calculation in LinearB
Deploy Frequency Metric