Table of Contents
One-Click Context in LinearB
Quickly uncover the branches and contributors behind your key metrics with One-Click Context—streamline investigation and decision-making with just a single click from any dashboard or report.
Understanding the “why” behind a metric is just as important as the number itself. With One-Click Context, you can quickly drill into the underlying branches and contributors that impact your key delivery and quality metrics—directly from the dashboard.
Explore the Context Behind Your Metrics
LinearB supports contextual exploration from multiple entry points in the platform. Whether you're reviewing your Cycle Time dashboard or scanning a delivery report, a single click provides insight into the branches driving those numbers.
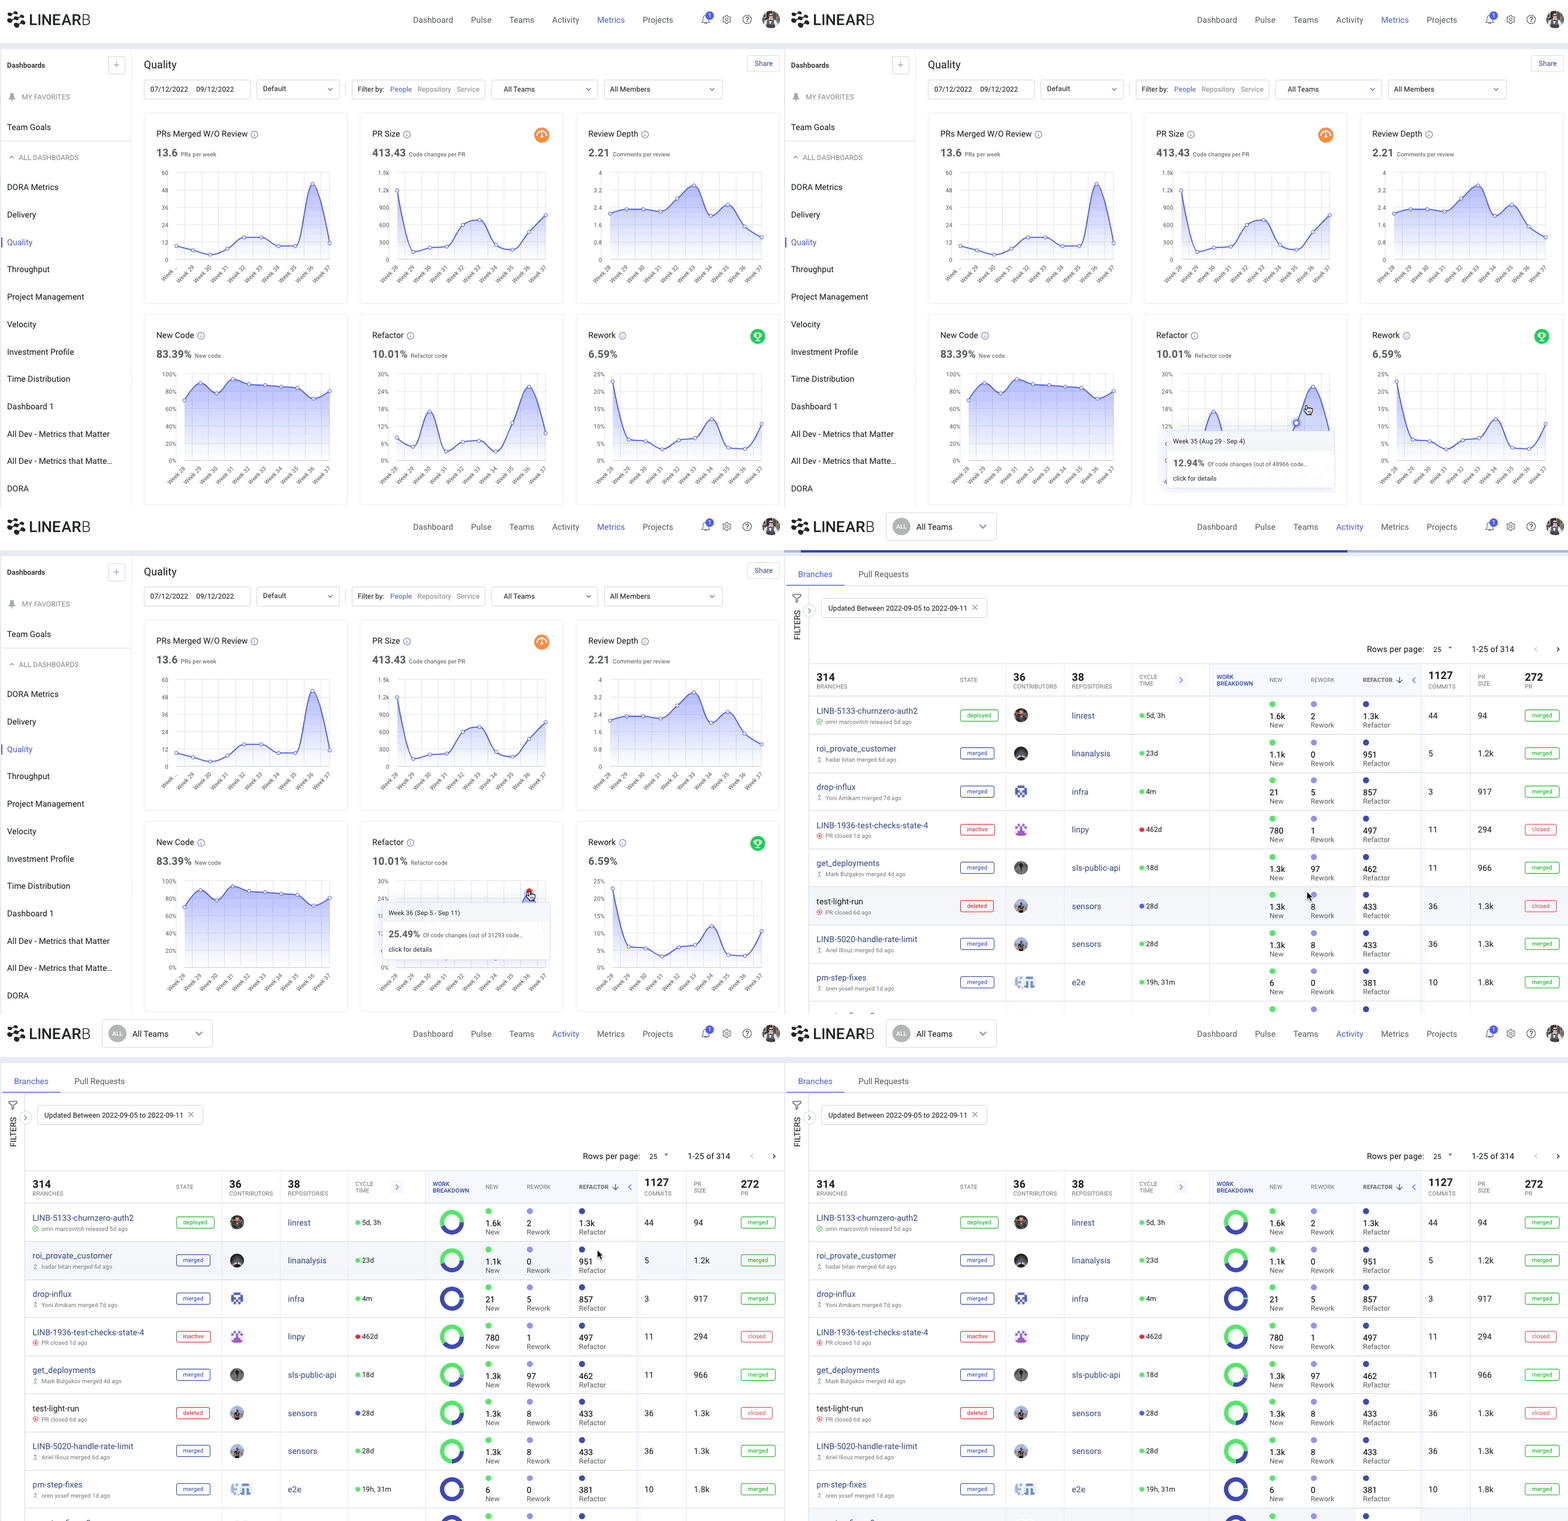
Clicking on a metric value or red segment in a widget will instantly open the Activity page, pre-filtered to show the most relevant branches contributing to that metric.
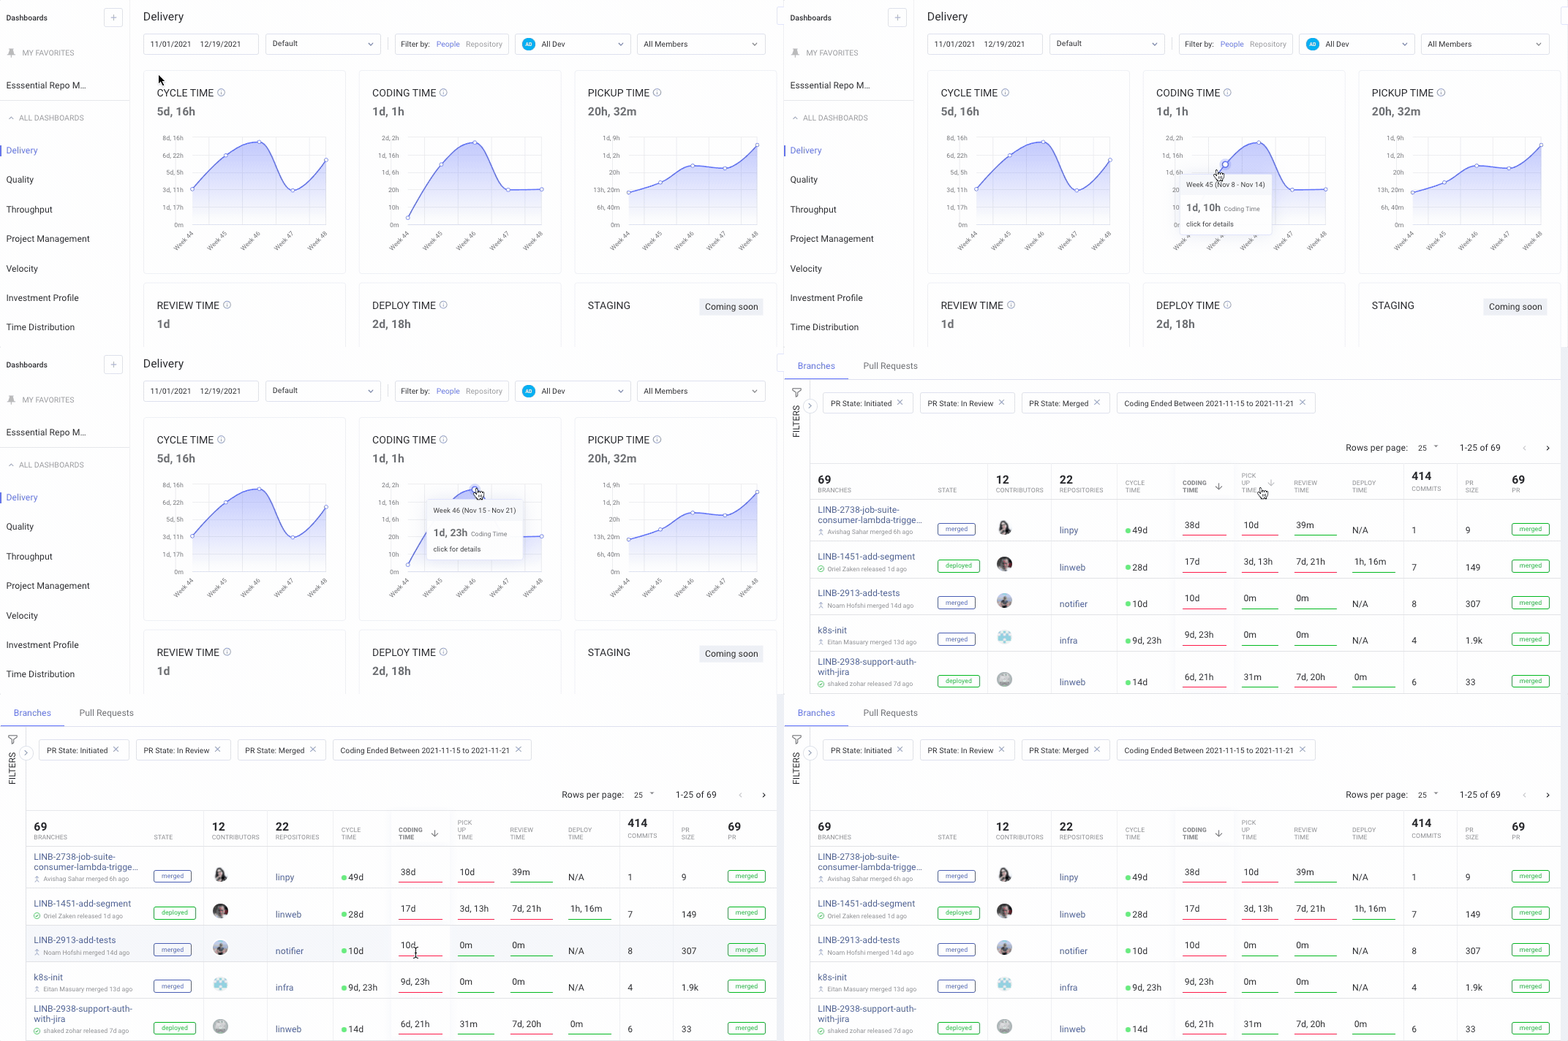
Click-Through Access from Cycle Time
The Cycle Time metric is one of the main metrics indicating the team's code delivery health. It breaks down code delivery into four measurable phases:
- Coding Time
- Pickup Time
- Review Time
- Deploy Time
Each of these phases is clickable in the dashboard. Selecting one navigates to the Activity view, which is sorted to surface branches most influencing the selected metric. This makes it easy to identify bottlenecks, inefficiencies, or standout contributions.


Investigating Metrics from Reports
Delivery Report (Metrics Tab)
From the Metrics tab, click on a specific metric value in your Delivery Report to open the Activity page. The results are sorted based on the metric you selected—making it clear which branches had the most impact.

Quality Report (Metrics Tab)
In the Quality Report, clicking a metric value reveals the branches that contributed to your final score. This helps highlight areas that may need attention, such as PRs with high rework or lower test coverage.
For both reports, column sorting in the Activity view adapts to the metric selected, ensuring the most relevant data is presented up front.


Contextual Insight, Delivered Efficiently
One-Click Context eliminates the guesswork behind performance trends and allows teams to move directly from dashboard observation to data-backed investigation.
Use it to:
- Pinpoint root causes behind metric spikes
- Identify which branches are driving delivery delays
- Spot early signs of risk or improvement

Related Resources
How did we do?
Filtering Team Insights With Git Scope
Team Dashboards - Team Only Mode