Table of Contents
Metrics Inspection in LinearB
Use LinearB’s Metrics Inspection feature to investigate trends, analyze anomalies, and gain deeper insights into your engineering performance—all within the metrics dashboard.
The Metrics Inspection feature in LinearB enables teams to analyze specific data points, investigate anomalies, and gain deeper insights into trends within engineering metrics. This tool helps teams identify outliers, inspect fluctuations in performance, and drill down into the root causes of metric changes without leaving the dashboard.


Accessing Metrics Inspection
To inspect a metric in LinearB’s Metrics Dashboard:
- Navigate to the Metrics tab.
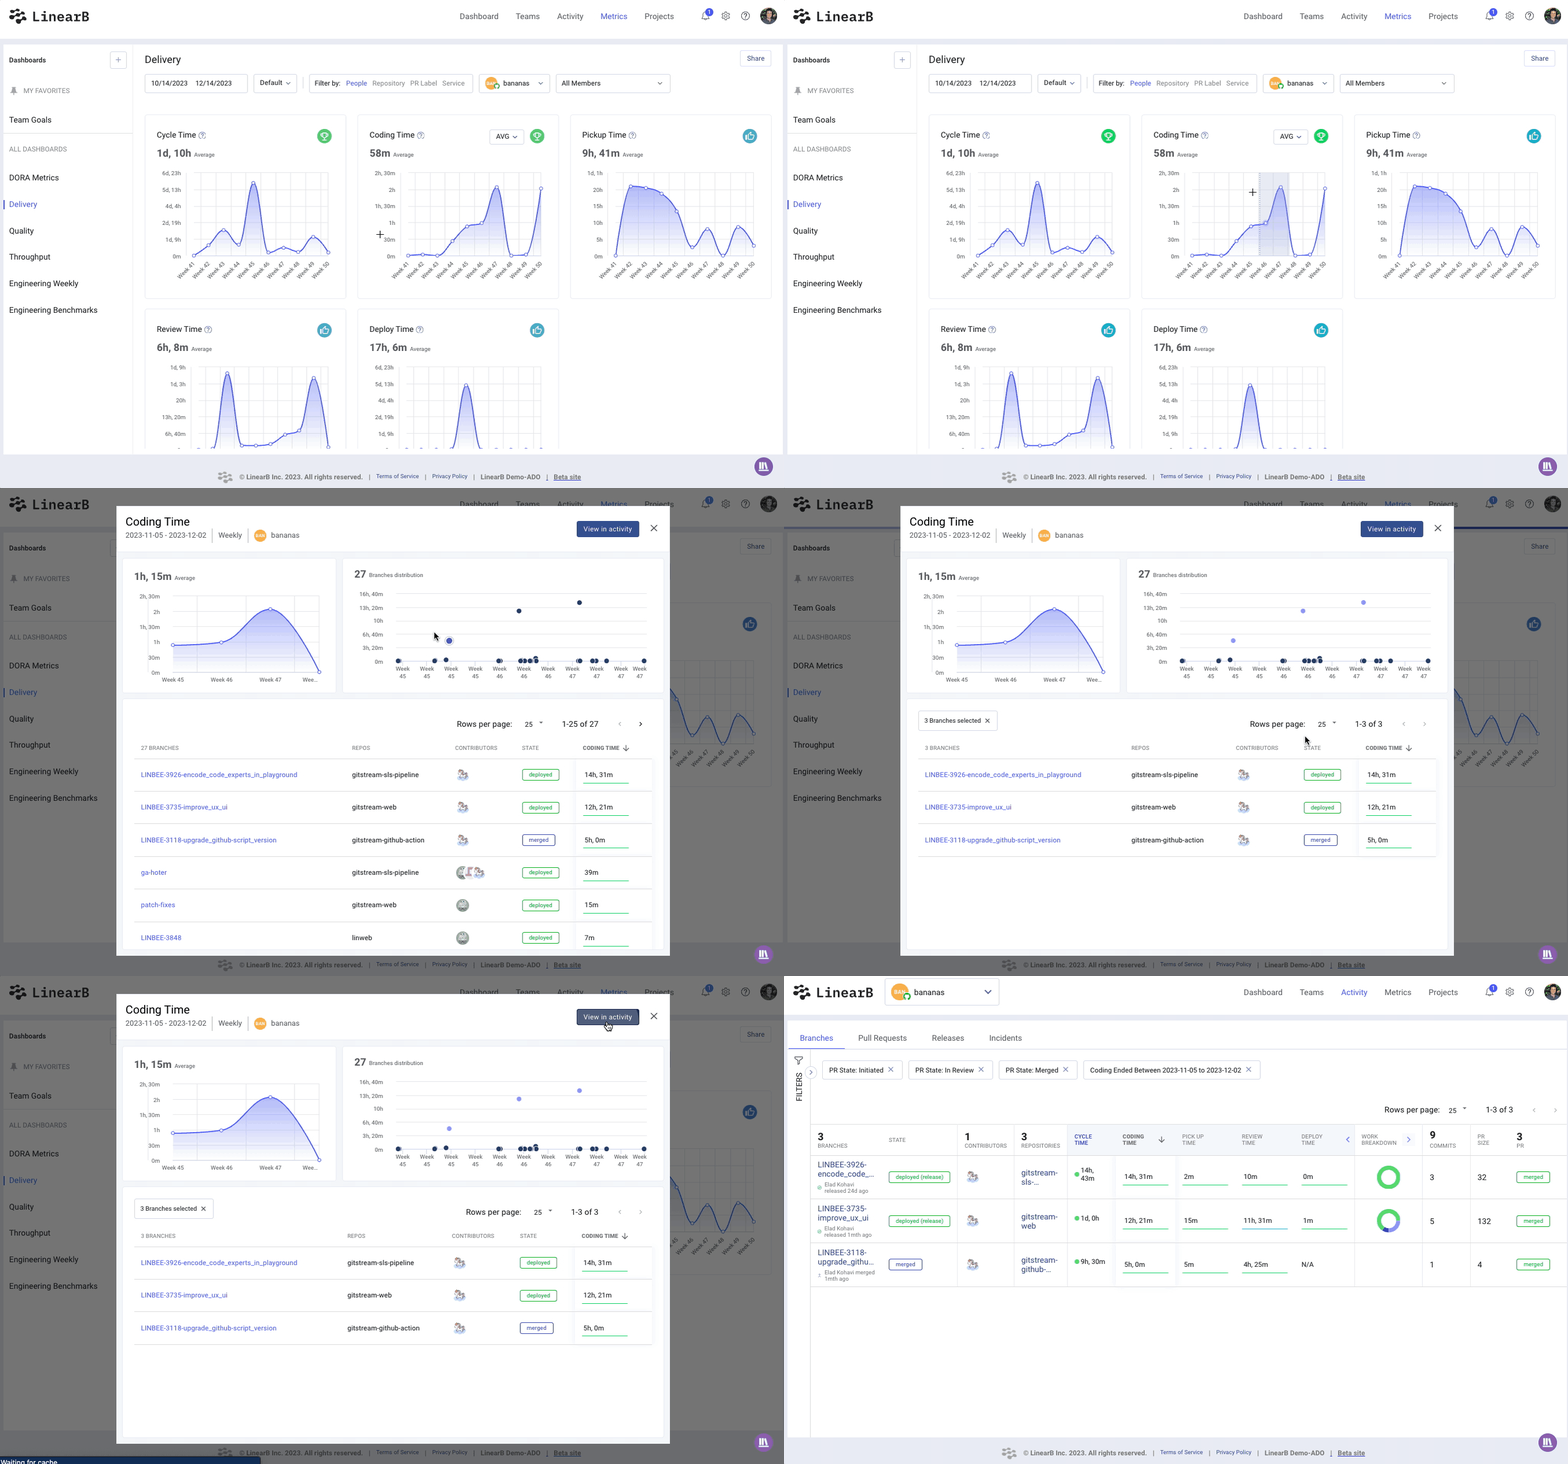
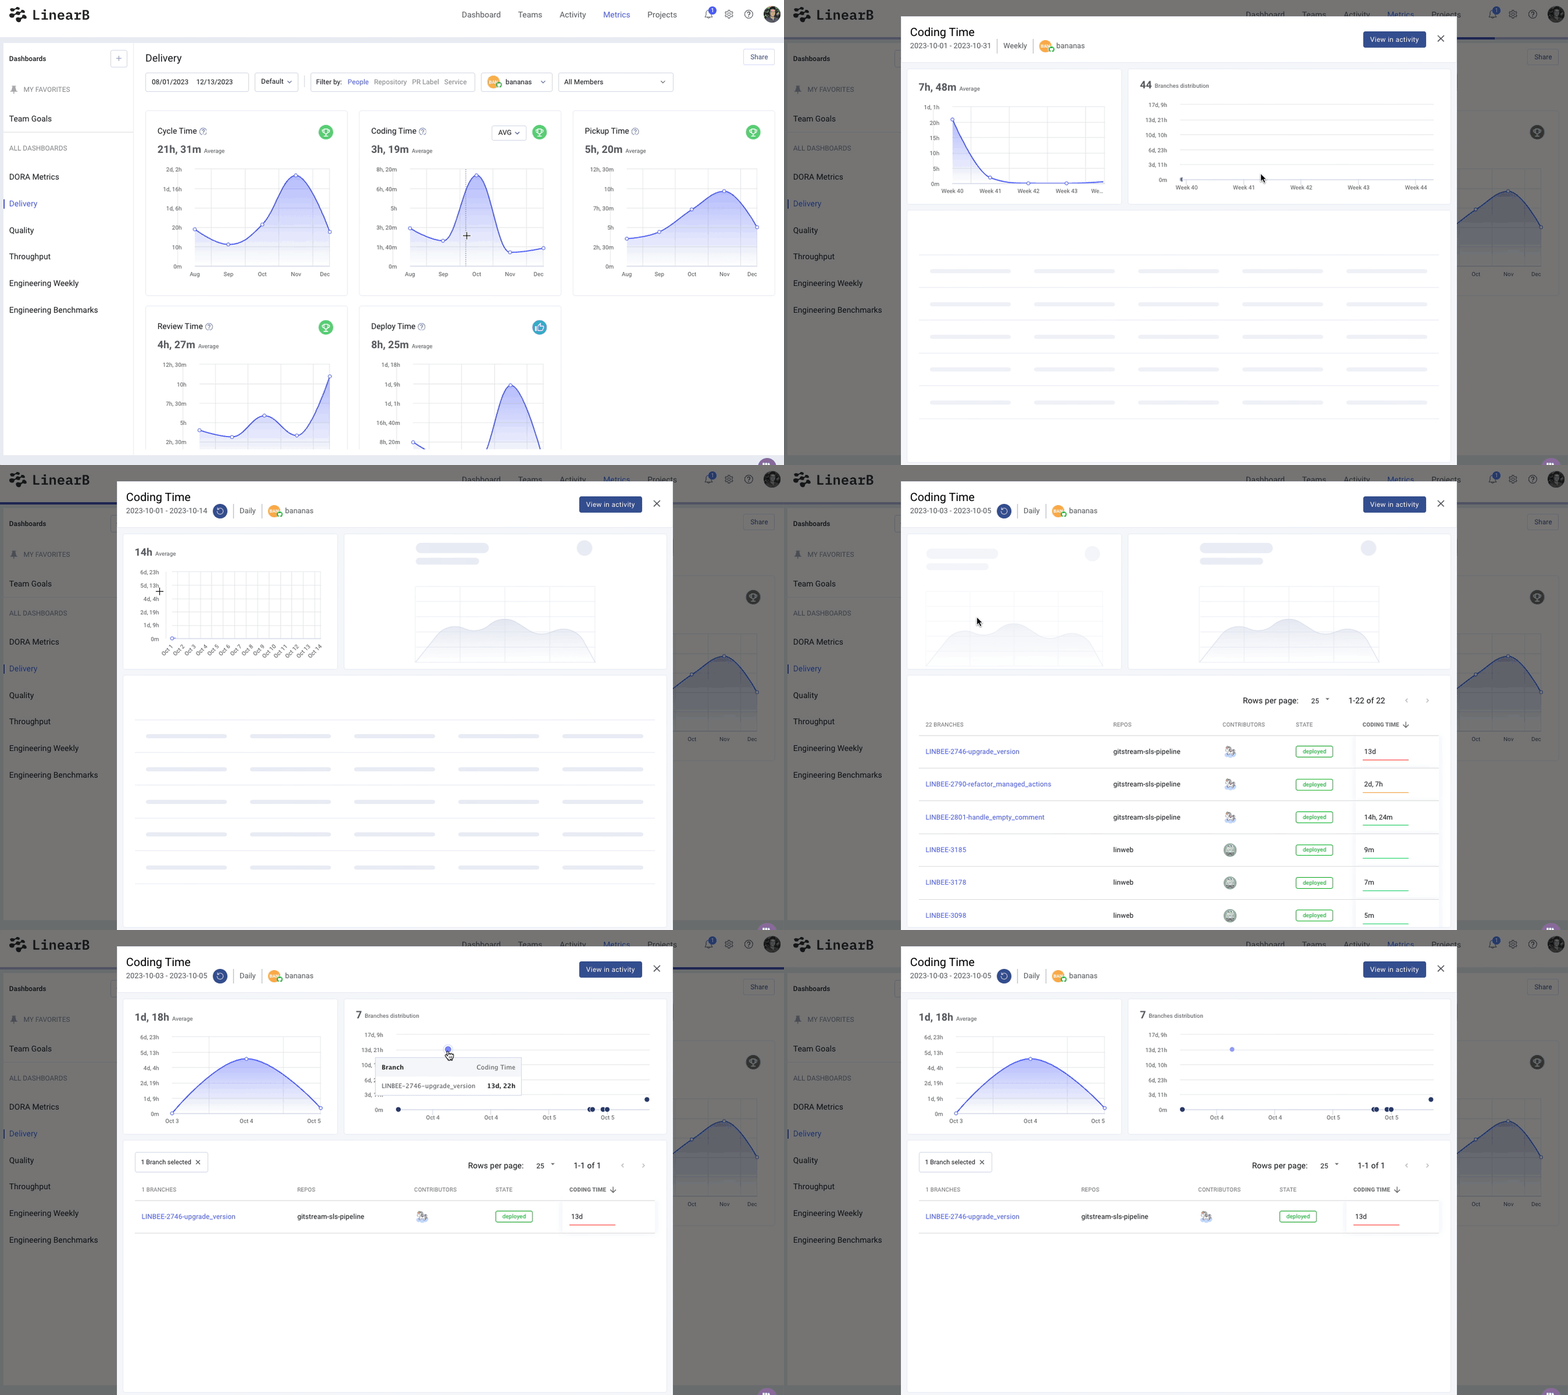
- Hover over any graph data point where an "Investigate Metric" flag appears.
- Click on the data point to open a detailed inspection view.
Alternative Exploration Method: Drag your mouse across a wider time range in any trend graph to highlight all branches relevant to that period.


Key Features of Metrics Inspection
Analyze Outliers & Anomalies
- Quickly identify spikes, drops, or unexpected deviations in engineering performance.
- Understand why certain metrics fluctuate over time.
Deep Dive into Specific Branches
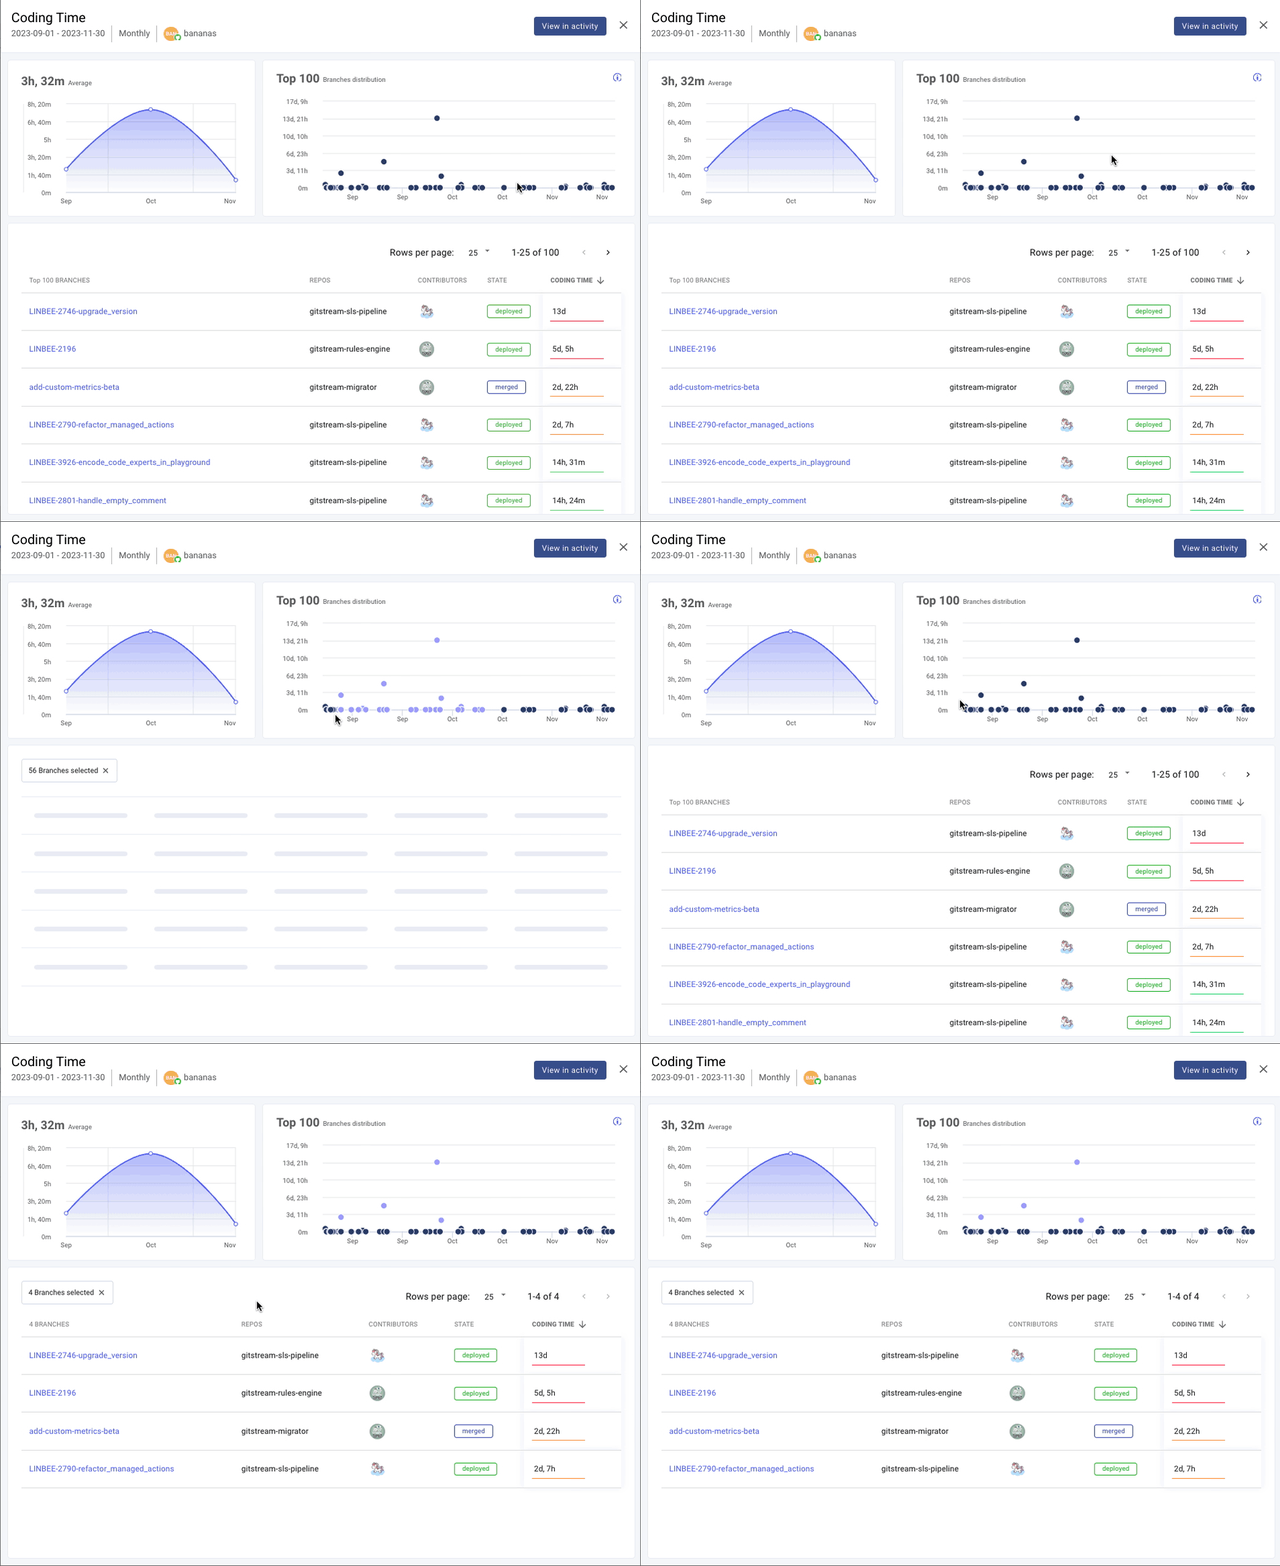
- Use the scatterplot boundary box to select and inspect branches within a timeframe.

- Highlight specific PRs or commits to see how they impact overall trends.
View Activity Details
- Click "View in Activity" to see all selected branches, including detailed metrics, timestamps, and contributors.
- Correlate metric changes with specific development events.

Why Use Metrics Inspection?
- Stay in Context – Investigate specific data points without leaving the main dashboard.
- Improve Decision-Making – Detect trends and act on insights faster.
- Enhance Workflow Analysis – Track how code changes, deployments, and reviews impact metrics over time.
By leveraging Metrics Inspection in LinearB, teams can quickly analyze trends, investigate anomalies, and optimize engineering performance with data-driven insights.
Related Resources
🔗 LinearB Engineering Metrics Benchmarks
How did we do?
LinearB Engineering Metrics Benchmarks
Repository-Level Metrics