Table of Contents
Understanding Project Delivery Trackers
The Project Delivery Tracker in LinearB provides real-time visibility into investment allocation, team performance, and project progress, enabling data-driven decision-making for Scrum and Kanban teams.

LinearB’s Project Delivery Tracker provides a high-level view of project progress within an organization. It integrates with Jira and enables tracking of PM boards, epics, labels, fix versions, and custom fields. The system is highly configurable, allowing teams to adjust tracking based on their needs and methodologies—Scrum or Kanban.

Main Page Overview
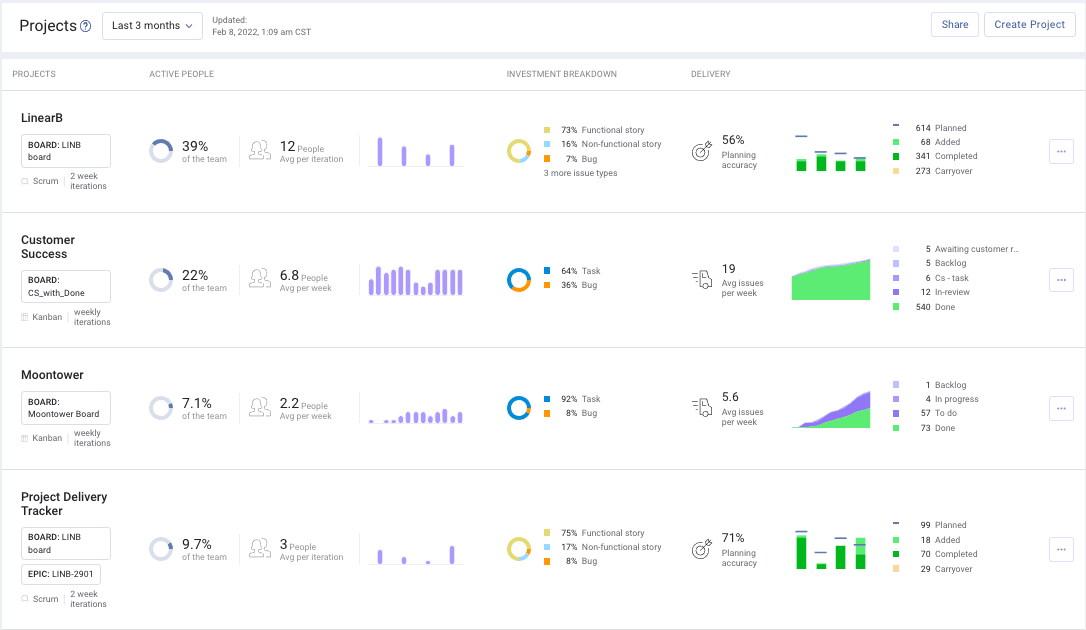
The Projects Dashboard offers an overview of all active projects and key performance indicators. It includes:
- General Project Information: Displays project name, agile methodology (Scrum/Kanban), and project cadence.
- Active People: Tracks the number of contributors and their effort over time.
- Investment Strategy: Shows completed work distribution by issue type.
- Delivery Performance: Evaluates efficiency based on methodology-specific metrics.
- Planning Accuracy: Measures the ratio of planned versus completed work, helping teams assess their commitment levels.

Key Metrics in Project Delivery Trackers
Planning Accuracy (Scrum)
Planning accuracy evaluates the ratio of planned issues or story points that were actually delivered. This metric helps teams assess the reliability of their sprint commitments:
- < 70%: Indicates potential overcommitment.
- > 95%: Suggests potential undercommitment.
- Formula: (Completed Planned Issues / Total Planned Issues) x 100%
Capacity Accuracy (Scrum)
Capacity accuracy determines how many issues or story points—both planned and unplanned—were completed in an iteration compared to the planned workload. This metric answers:
- Is my team taking on an amount of work that they can reasonably complete?
Velocity (Kanban)
Velocity tracks the average number of completed issues per week and provides a week-by-week breakdown to help teams identify trends in delivery efficiency.
Expanded Project Delivery Tracker View
Clicking on any Project Delivery Tracker provides an in-depth breakdown of:
- Planning Accuracy Scores (Scrum)
- Velocity Trends (Kanban)
- Detailed Delivery Breakdown (Scrum/Kanban)
- Investment Strategy Insights
- People Effort and Contribution Analysis
- Single Iteration/Week Breakdown: Click on a sprint or week to access details such as planning accuracy, delivery trends, and investment distribution.
- Time Range Customization: Click on the "Last 3 months" dropdown to adjust the displayed timeframe.
Delivery Breakdown
The Delivery section presents project data differently depending on whether the project follows Scrum or Kanban:
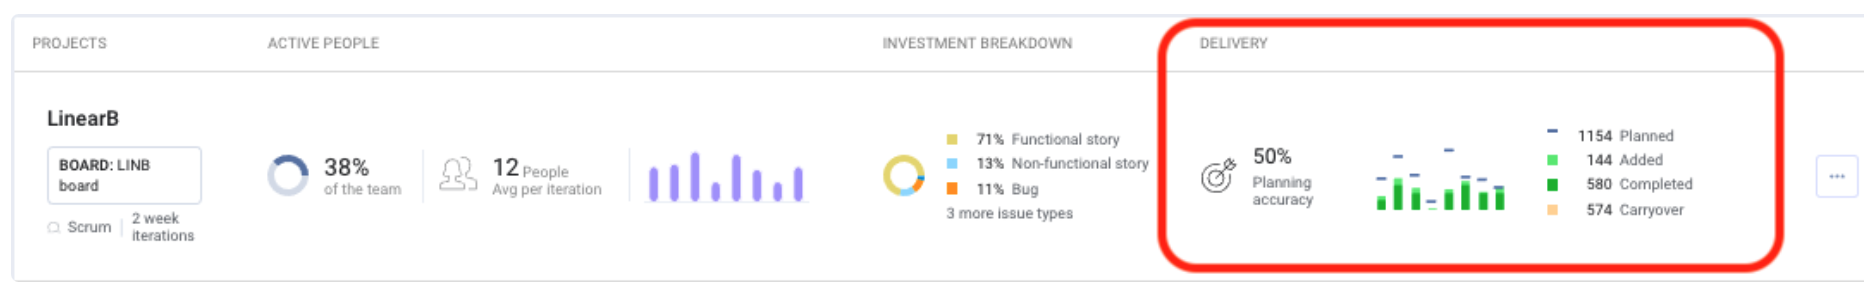
Scrum
- Planned Issues/Story Points: Issues or story points defined at the start of a sprint.
- Hover over each section to see the number of planned items that were completed or left unfinished.
- Added Issues/Story Points: Items introduced more than 24 hours after the sprint began.
- Hover over each section to see completed vs. uncompleted added issues.
- Average Completed/Added Work: The average number of completed and added issues/story points per iteration. Tracks execution performance.
- Switchable Views: Toggle between planned work and overall completion.
- Scrum Accuracy Scores: Evaluates planning accuracy per iteration.
- Deep Dive into Individual Projects: Click on any Project Delivery Tracker to open an Expanded View for more granular insights.
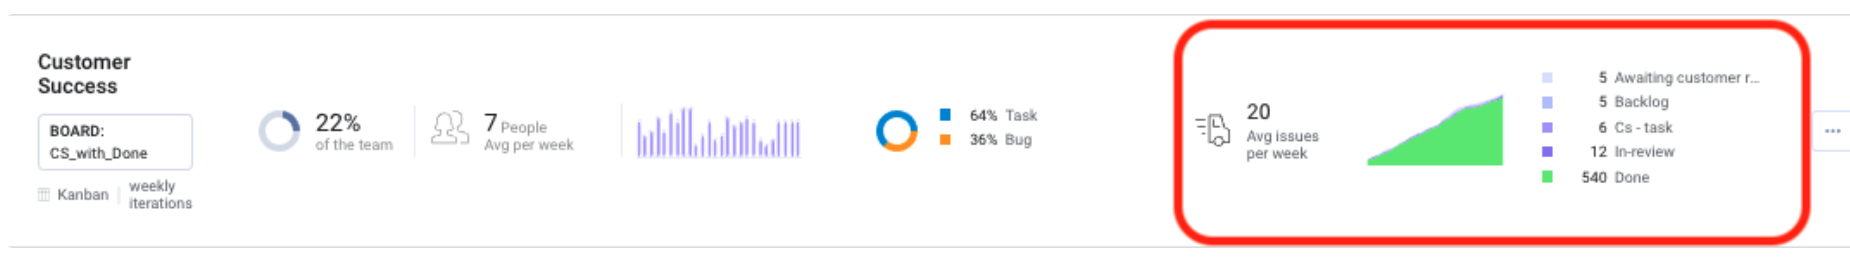
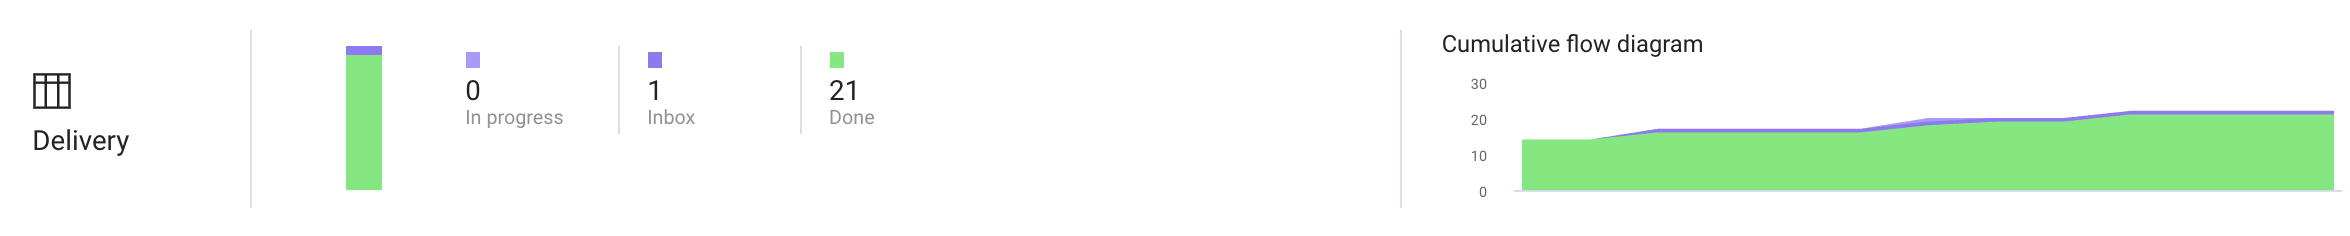
Kanban
- Cumulative Flow Diagram: Displays issue/story point distribution across Jira swim lanes. Data is gathered directly from the Jira boards associated with the Project Delivery Tracker.

Considerations for Data Accuracy
- Project Delivery Trackers can span multiple iterations, collecting data across a custom date range that may differ from what Jira displays.
- Trackers can pull data from multiple Jira boards, epics, and labels, meaning issue counts may not always match individual board summaries.
- Unplanned tickets left open and unclosed during an iteration are excluded—trackers focus solely on completed tasks.

Investment Strategy
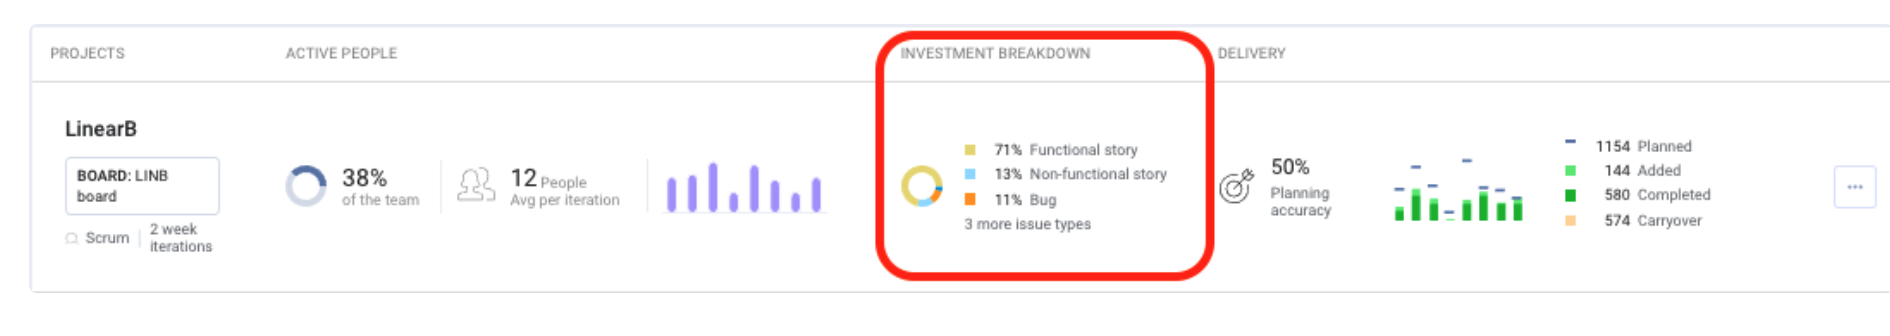
The Investment Strategy page provides a visual breakdown of resource allocation by issue type, leveraging data from your project management platform. Since issue types are highly configurable, LinearB dynamically displays all Jira issue types found within the connected boards of your Project Delivery Tracker.
The Investment Strategy breaks down work by issue type and shows:
- Percentage of work allocated to various issue categories.
- Weekly/iteration-based breakdowns for deeper insights.
- The ability to toggle between issue count vs. story points.
- Investment Over Time: Tracks the percentage of work attributed to different issue types across iterations.

People Metrics
Active People / People Effort
- Percent of Team Members Invested: This metric calculates the ratio of active contributors (team members who moved tickets to 'Done' during a sprint or period) compared to the total number of team members across all projects.
- Average Number of Active Team Members Per Iteration: The sum of active contributors per iteration divided by the number of iterations being tracked. Changing the date range updates this number.
- Most Active Team Members: Identifies team members who contributed to the most iterations/weeks displayed in your Project Delivery Tracker. If your Project Delivery Tracker is viewing a 6-week span, and a contributor has moved a ticket into done status in each of these weeks, they will be marked as active for 6 weeks, and will likely be your most active contributor.
- People Effort Over Time: Displays the number of unique users completing work per iteration/week via a trend graph. The graph displays the number of users who have marked an issue as done in each iteration/week.
- People Breakdown: Click on a specific iteration to see individual contributor details.

Understanding the Percent of Team Members Invested
- Active contributors are defined as users assigned to tickets that were moved to 'Done' within the sprint or time frame. If a ticket lacks an assignee, the reporter/creator is considered.
- The denominator (total team members) includes all active contributors across all Project Delivery Trackers, shown at the top of your Projects page.
- Since contributors may participate in multiple projects, summing percent of team members invested across all projects may exceed 100% due to overlap.

Customizing Project Delivery Trackers
Inclusions for Tracking
- Jira Boards: Include multiple Jira boards in a single project and refine results using additional filters such as epics, labels, or custom fields.
- Epics: Monitor cross-functional work by combining multiple epics from different boards.
- Labels: Group related issues from multiple boards using shared labels to track feature development and resource allocation.
- Fix Versions: Align project tracking with scheduled release dates.
- Custom Fields: Utilize any Jira field to classify issues (e.g., infrastructure, technical debt) for deeper analysis.
Using the PDT Module Search
Quickly find projects by:
- Navigating to the PDT Module within your account.
- Entering at least two characters related to the project name.
- Viewing all matching projects containing the entered characters.
- Selecting a project to view detailed information.
Search Features:
- Case-insensitive lookup.
- Search using any part of the project name.
Additional Features
- Single Iteration/Week Breakdown: Drill into specific sprints or weeks for detailed insights.
- Export as PNG: Generate a shareable project snapshot for stakeholders.
- Configuration: Admins can create, edit, and delete Project Delivery Trackers as reporting needs evolve.
- Switch Between Views: Toggle between delivery by planned work or completion to analyze execution trends.
- Expanded People Metrics: View detailed team contributions, including active team members, frequency of contributions, and effort distribution.

Related Articles
How did we do?
Team Iterations & AI Iteration Summary
Understanding the Iterations View