Table of Contents
Cycle Time Calculation in LinearB
Learn how LinearB calculates Cycle Time across four key development phases—Coding, Pickup, Review, and Deploy—so you can identify bottlenecks, track delivery efficiency, and surface improvement opportunities across your teams.

Cycle Time measures how long it takes engineering work to move from initial development to production. It reflects your team’s ability to deliver software efficiently by breaking the delivery process into four distinct phases:
- Coding Time
- Pickup Time
- Review Time
- Deploy Time
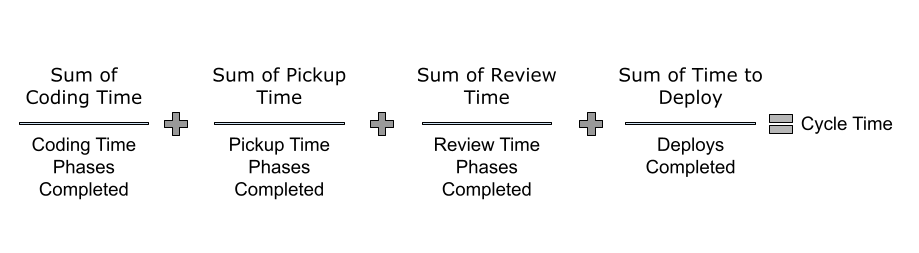
Cycle Time is calculated by averaging the duration of these phases across all branches within a selected time range or iteration. Understanding where time accumulates can help identify bottlenecks and drive process improvements.

Coding Time
Definition: The time between the first commit on a branch and the moment a pull request (PR) is opened.
- If Jira-based coding time is enabled, this phase starts when a linked Jira issue is moved to In Progress.
- Draft PRs are counted as coding time.
- Learn how to enable this: Jira-Based Coding Time

Pickup Time
Definition: The time between when a PR is opened (or moved from draft to active) and the first non-author comment.
- If a PR is approved or merged without comments, pickup time is calculated from the PR open time to the approval or merge timestamp.
- Comments from the PR author do not count toward triggering review time.

Review Time
Definition: This measures the time between when a code review begins and when a PR is merged. Pickup time ends and review time begins only when someone other than the PR author performs a review action.
- Comments or reviews from the PR author (i.e., self-reviews) are ignored for this transition.
- If a PR is approved or merged without any comments, LinearB records the review time for this PR as 0.
This metric helps teams evaluate how long it takes to complete peer reviews once collaboration has started.

Deploy Time
Definition: The time between when a PR is merged and when it is released to production.
- LinearB listens for release tags and maps them back to branches.
- You can customize your release detection rules here: Release Detection Setup

Cycle Time Inclusion and Phase Completion Behavior
All Branches Are Included—Even Incomplete Ones
Cycle Time tracks all branches worked on during a selected iteration or date range, regardless of whether they were completed.
Because Cycle Time is calculated as an average of each completed phase, any branch that progresses—even partially—will be included in the calculation. For example:
- If your team works on five branches during a sprint:
- Two branches progress through coding and code review but are not deployed.
- Three branches are fully deployed.
Cycle Time will include:
- Coding Time and Pickup Time for the two incomplete branches.
- Full Cycle Time (all four phases) for the three completed branches.

Team-Based Tracking Only
Cycle Time is a team-level metric. It tracks the progress of branches through the development lifecycle—not the performance of individual developers.
Whether one or several engineers contribute to a branch, the metric only reflects how the branch moves through each phase, making it ideal for evaluating overall process efficiency

Time Is Counted Only After a Phase Is Completee.
LinearB does not include time spent in a phase until that phase is fully completed. For example:
- Coding Time is not counted until a pull request is created.
- Review Time is not counted until the PR is merged.
- Deploy Time begins only after the PR is merged and ends when the branch is released.
This approach ensures that ongoing work doesn’t skew your averages. However, when a long-running branch finally moves forward, you may notice a sudden increase in your Cycle Time—as the system retroactively includes the full time spent in the newly completed phase.

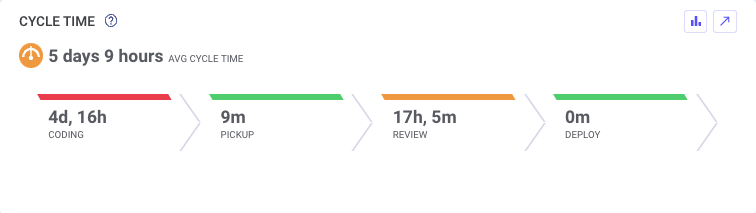
Cycle Time in the Dashboard View
The Dashboard displays Cycle Time for your entire organization or a specific team, based on the currently selected iteration or weekly view. Cycle Time is calculated from active branch data and segmented into four phases—Coding, Pickup, Review, and Deploy.
- Segment colors range from green to red, reflecting performance benchmarks based on LinearB’s community standards.
- If complete data isn’t yet available—for example, if a PR hasn’t been deployed—an asterisk (*) will appear, indicating that data collection is still in progress.
You can toggle between teams and timeframes to drill down into specific activity:
- Selecting a team filters Cycle Time to reflect branches worked on by that team’s members. This includes code commits, PR creation, and reviews.
- Selecting a different timeframe shows cycle performance for other sprints or weeks, helping you compare trends and team velocity over time.

Activity View: Cycle Time by Branch
The Activity tab provides a detailed breakdown of Cycle Time for individual branches, allowing you to inspect how each branch progresses through the development lifecycle.
- Each phase—Coding, Pickup, Review, and Deploy—is color-coded from green to red, based on LinearB’s community benchmarks.
- Cycle Time is calculated using precise timestamps as the branch advances from its first commit through to deployment.
This view is ideal for identifying outliers or bottlenecks on a per-branch basis, helping teams take targeted action when specific work items fall behind.

Metrics View: Tracking Cycle Time Trends
To analyze how Cycle Time evolves over time, navigate to the Metrics tab and open the Delivery dashboard. This view provides a time-based breakdown of Cycle Time, allowing you to monitor trends across sprints, weeks, or custom date ranges.
- The dashboard displays both overall Cycle Time and individual phase durations: Coding, Pickup, Review, and Deploy.
- You can filter by team to focus on specific groups, and adjust the date range to align with your reporting needs.
- For even more flexibility, add a Cycle Time widget to any custom dashboard to track it alongside other KPIs that matter to your team.
This view is ideal for retrospectives, leadership reporting, and process optimization over time.

Learn More
- Streamlined Engineering Data Leads to 55% Decrease in Cycle Time at Intsights
- What is Cycle Time? (LinearB Blog)
- Cycle Time: Measuring and Improving Team Process

Related Articles
How did we do?
Coding Time Metric
Cycle Time Metric