Table of Contents
Selecting Multiple Teams in a Metrics Report
Compare multiple teams' performance in LinearB metrics reports by selecting up to six teams, customizing data views, and creating dashboards for streamlined cross-team analysis.
Updated
by Steven Silverstone
LinearB allows you to analyze and compare multiple teams' performance within a single metrics report. This feature, available on all metrics reports including custom reports, helps team leads and engineering managers track cross-team activity, measure efficiency, and compare key metrics at a glance.


Viewing Multiple Teams in a Metrics Report
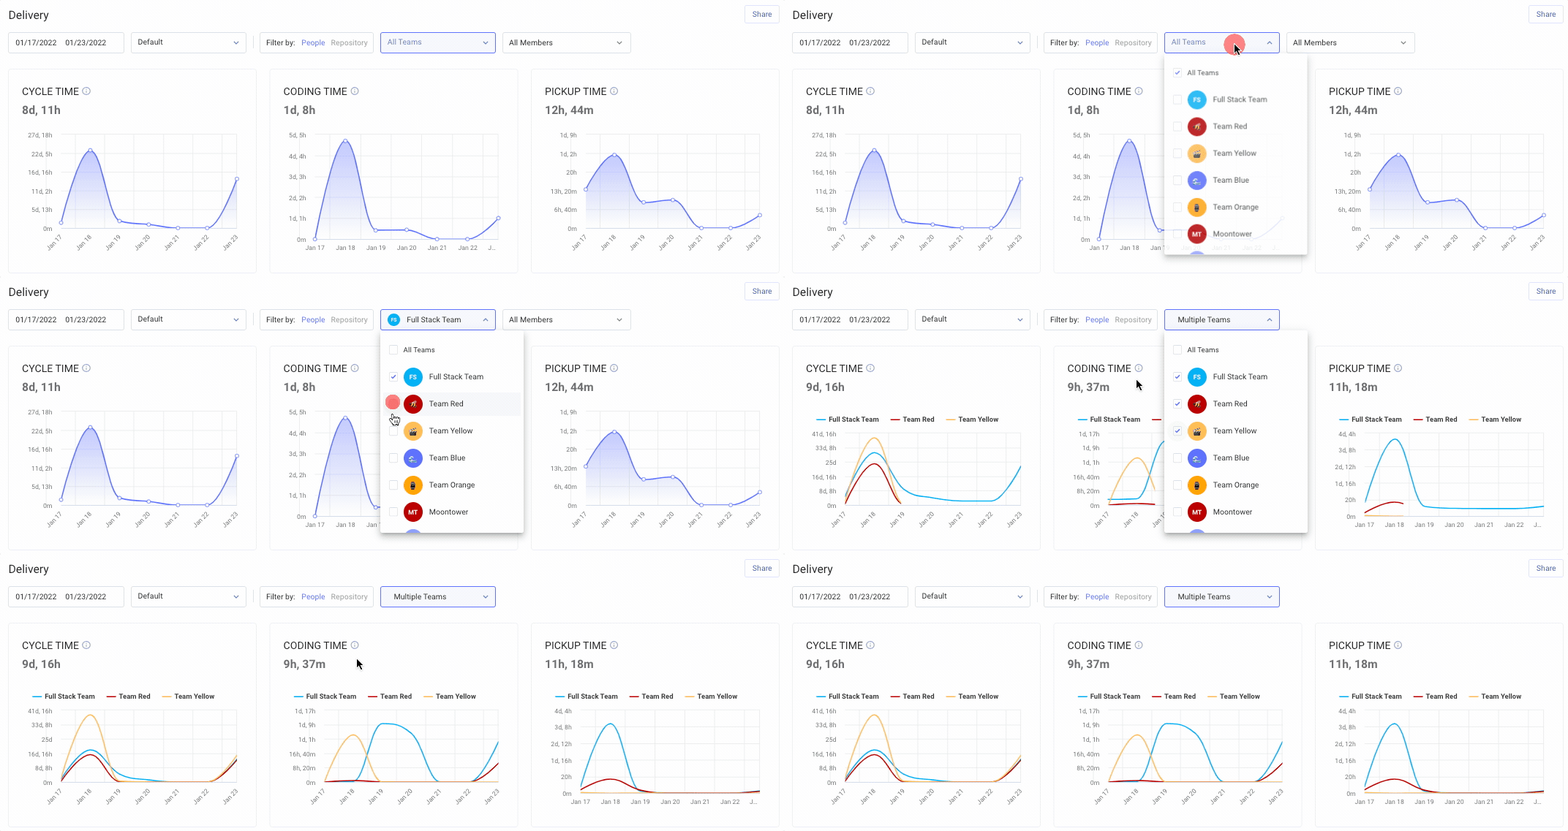
To display multiple teams within a metrics report:
- Open a Metrics Report in LinearB.
- Click on the Teams dropdown menu at the top of the report.
- Select up to six teams to include in the comparison.
- Each selected team will be assigned a unique color in the graph for easy differentiation.
How Metrics Adjust for Multiple Teams
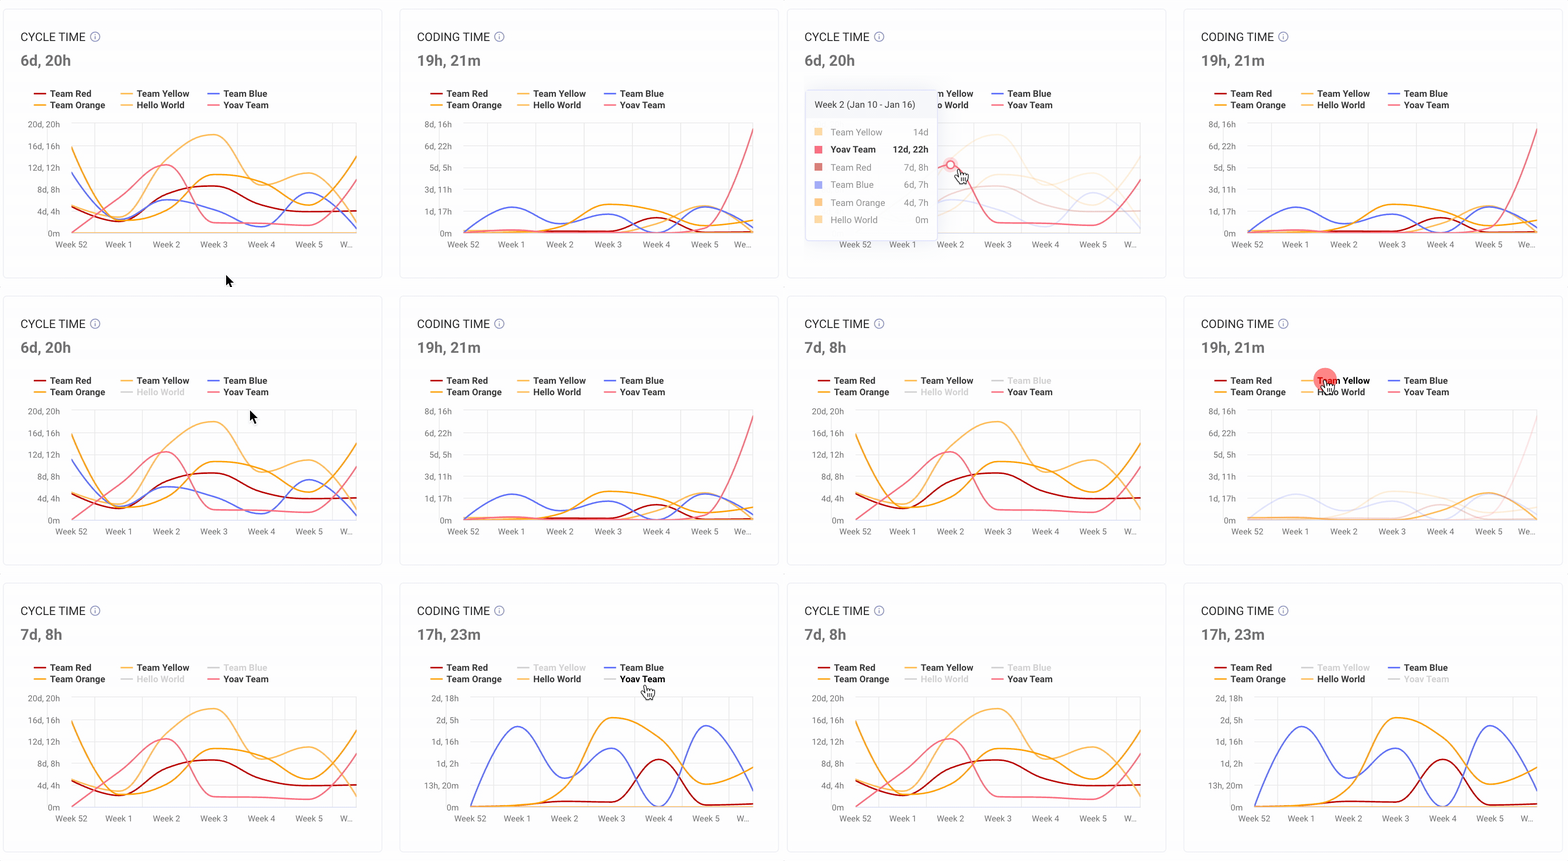
- The number displayed at the top of each metric widget represents the average value across all selected teams.
- You can further refine the report by removing individual teams from specific metric widgets—just click on the team name within the widget.
- If a team is removed, the overall average at the top of the widget updates dynamically.


Creating a Custom Dashboard for Multiple Teams
For team leaders overseeing multiple teams, LinearB allows you to create a custom dashboard that consolidates all relevant team activities in one view.
Steps to Build a Multi-Team Dashboard
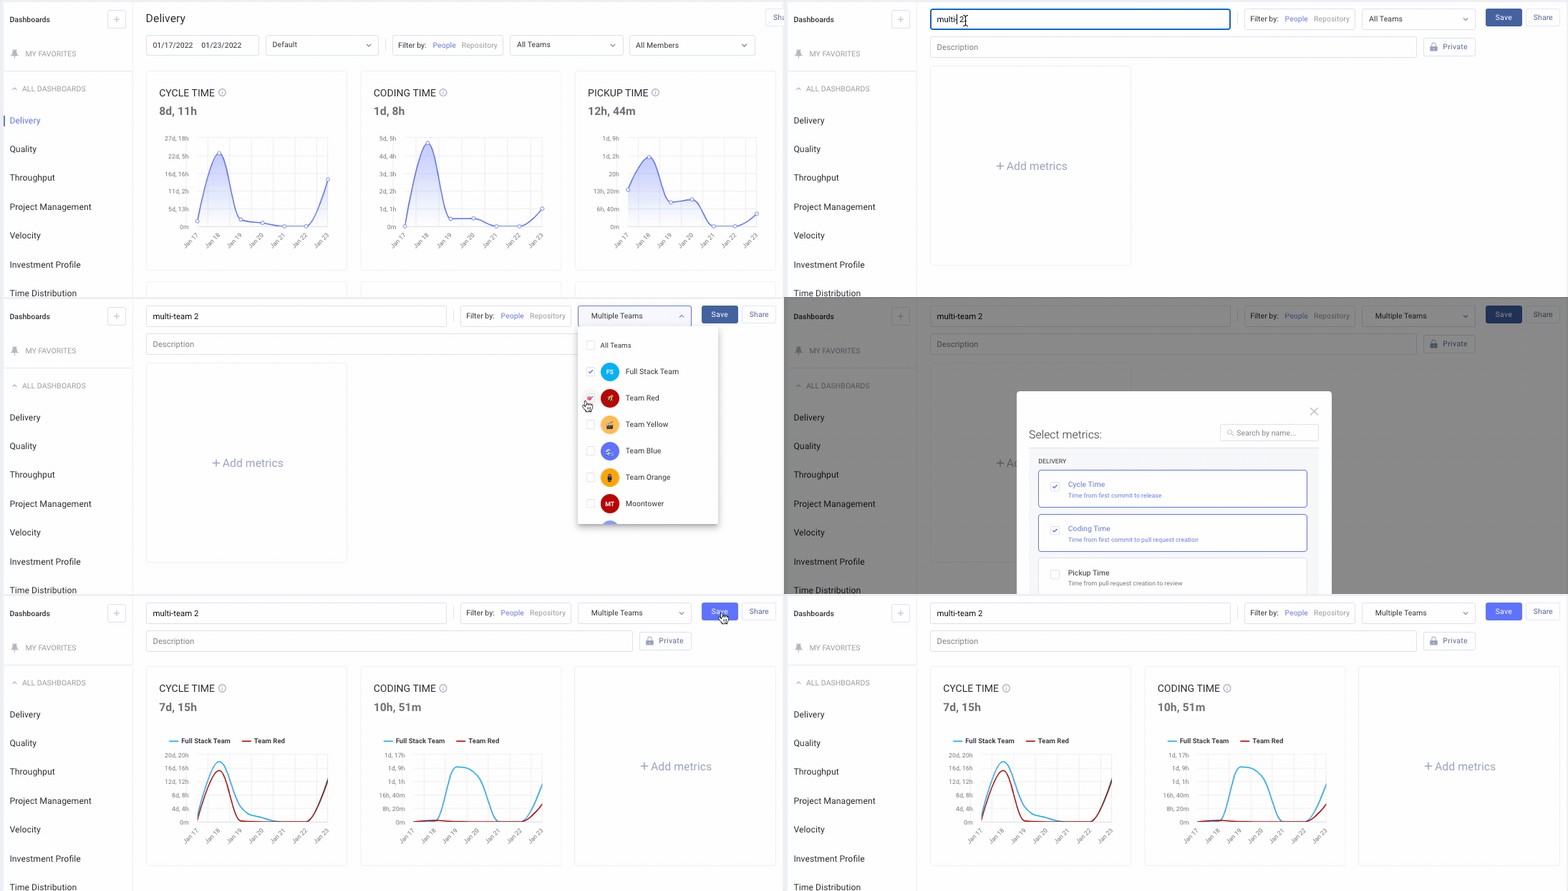
- Create a new dashboard in LinearB.
- Select the teams you want to track collectively.
- Choose the metrics that matter most to your teams.
- Save the dashboard—LinearB will remember your selected teams for quick access in the future.
🔗 Learn more about building a custom metrics dashboard


Related Resources
How did we do?
Repository-Level Metrics
Sharing LinearB Metrics and Projects