Table of Contents
Building Custom Metrics Reports in LinearB
Utilizing custom investment reports, you can build reporting dashboards on your Jira issue activity based on multiple criteria.

LinearB allows for the tracking of custom Metrics, in addition to our pre-built Metrics options. To leverage these custom metrics, you'll need to connect your PM tool and/or import custom metrics using our Report Event API (full API documentation here).
How to create a custom metrics dashboard
Open the Metrics tab in LinearB, and click the plus sign next to Custom Dashboards. This will open a link to select the metrics you wish to track.
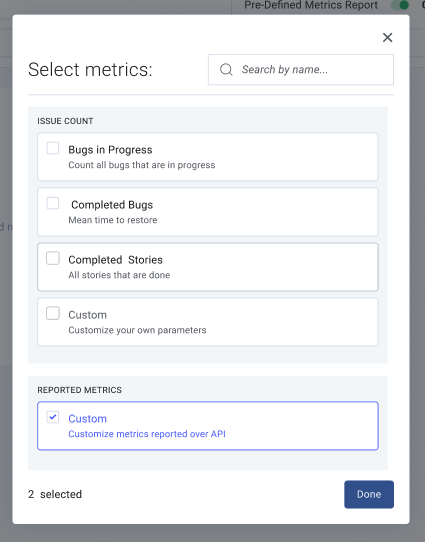
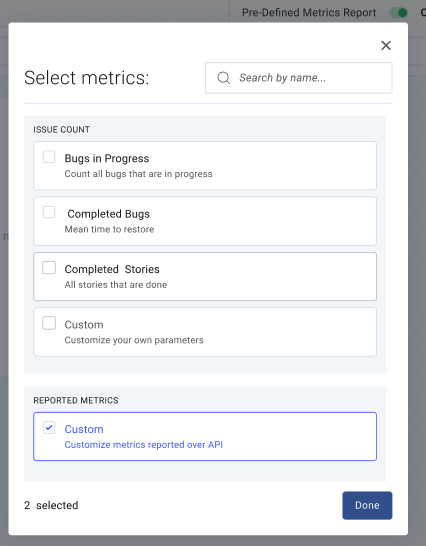
By default, there are 4 metrics widgets available: Bugs in Progress, Completed Bugs, Completed stories, and Custom. Additionally, if you have custom metrics passed via the Report Event API, you will see a Reported Metrics option, as well. Select any or all of these to add to your dashboard. Note that you can add several of the same widget and customize each one to see different metrics.
The following metrics can be configured on any widget:
- Metric Type
- Display counts of issues, or the sum of story points assigned to issues.
- Scope
- Filter which issues this widget displays. Widgets can pull issues for Jira or Azure boards, epics, labels, fields, LinearB teams, or combinations thereof. Note that these filters build on each other, meaning if a board and label are selected, LinearB will only display issues in a board that contain the label.
- Issue Type
- This data is pulled from your PM tool instance and can be any issue type built into your instance. Multiple issue types can be selected.
- Jira/Azure State
- Single Jira/Azure State
- Collects all issues that were in the selected Jira/Azure state at any point in the designated time frame.
- Example: Any issue that was set to "in QA" at any time in the day, week, or month displayed.
- Transition between 2 states
- Collects all issues which transitioned from one state to the second.
- Example: All issues which moved from "in progress" to "In review".
- Single Jira/Azure State
Customizing a metrics widget
Click on the gear icon next to any widget to customize the data displayed.
Building a custom metrics widget
In order to build a custom metrics widget, click on the "+ Add Metrics" button on any dashboard. Check the Custom checkbox and click Done. A new metrics widget will appear in your dashboard. Click on the gear icon inside the widget to customize your metrics.
Building a custom Reported Metrics widget
If you are tracking custom metrics in LinearB using our Reported Event API, you can track those values over time using the Reported Metrics widget. Select the Custom option in the Reported Metrics section:
From there, select the name of the reported metric you wish to track, the display name for the dashboard widget, and how you wish to group the metrics:
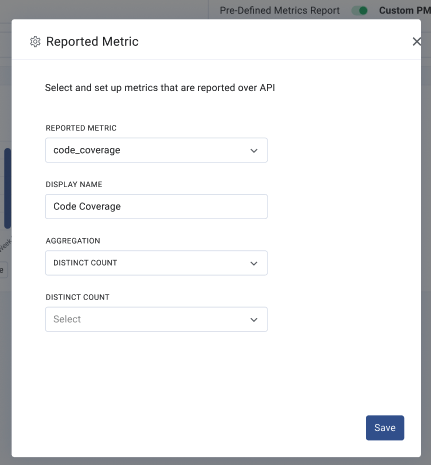
For more information, please see the Reported Metrics API Documentation.
Custom Metrics FAQs
I see a difference between daily and weekly numbers
It's very possible that an issue enters a specific state, or transitions between two states multiple times in its lifetime. For example, an issue goes between "in progress" to "in review" states two times as a team QAs a ticket. When viewing a monthly breakdown of issues "in progress", this issue will be counted once, as it was in this state during that month. However, if you change a report to view a daily breakdown, this issue will be included in counts on each calendar day the issue was in the "in progress" state.
What timezone are these reports using?
Days are measured using the UTC timezone.
I should have more issues in my done issues widget.
The Done filter in these widgets will only count issues that transition to done (and remain in done) in that particular day. If an issue is removed from the done state, it will not be counted.
How did we do?
Building a Metrics Dashboard in LinearB