Table of Contents
Sharing LinearB Metrics and Projects
Easily share LinearB metrics, dashboards, and project data through links, CSV exports, PNG files, or API integrations for seamless team collaboration.

LinearB provides multiple options for sharing metrics, reports, and project data, ensuring that teams can collaborate effectively. Whether sharing a dashboard, exporting data, or integrating with APIs, LinearB makes it easy to distribute insights across your organization.

Sharing a Dashboard Link
Use the Copy Link to Dashboard button to generate a shareable link that includes:
- Selected filters
- Date ranges
This allows you to send specific metrics or timeframes to your team via Slack, email, or other communication tools.
Private dashboards cannot be shared—only users with access can open the link.

Exporting Data from LinearB
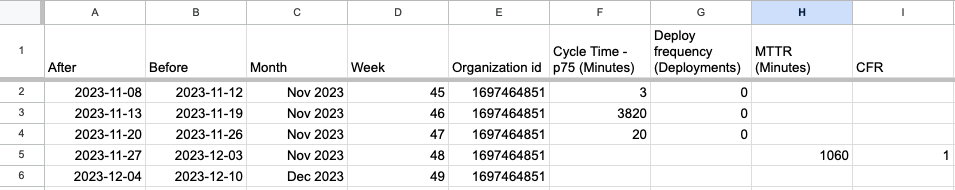
Export as CSV
Clicking the Export as CSV button downloads a .csv file containing your dashboard’s metrics.
- Each metric widget is represented as a column in the exported file.
- All date ranges are listed as rows for clear time-based analysis.
CSV Export Availability:
✅ Available for pre-defined dashboards, including:
- DORA Metrics
- Delivery Metrics
- Quality Metrics
- Throughput Metrics
✅ Available for personal boards created using standard metric widgets.
❌ Not available for Custom PM Metrics reports.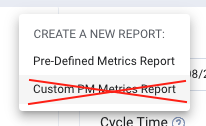

Export as PNG
Clicking the Export as PNG button generates an image file (.png) of your dashboard.
- Ideal for presentations, reports, or sharing in meetings.
- Preserves visual formatting for easy interpretation.

Integrating with the LinearB Metrics API
For programmatic access to detailed engineering metrics, use the LinearB Measurements API.
- Retrieve a wide range of metrics beyond those available in the UI.
- Automate data collection for custom reporting and analysis.
🔗 Learn more about the LinearB API here
Generating an API Token
To start using the API:
- Create an API token using the official guide.
- Use the token to query LinearB metrics, deployment data, and incident reports.
🔗 Generate a LinearB API Token

Exporting Resource Allocation Data
To download Resource Allocation data as a CSV file:
- Navigate to: Projects > Resource Allocation
- Click Export CSV
- The export will match the data in your active table view:
- Projects Tab: Exports data at the project level.
- Initiatives Tab: Exports data grouped by initiatives.
This ensures that exported data matches your active filtering selections.

How did we do?
Service Metrics
Time Distribution Dashboard in LinearB