Table of Contents
LinearB's Updated Navigation
Explore LinearB’s redesigned navigation—an improved layout that organizes key tools, reports, and dashboards in a single streamlined sidebar.
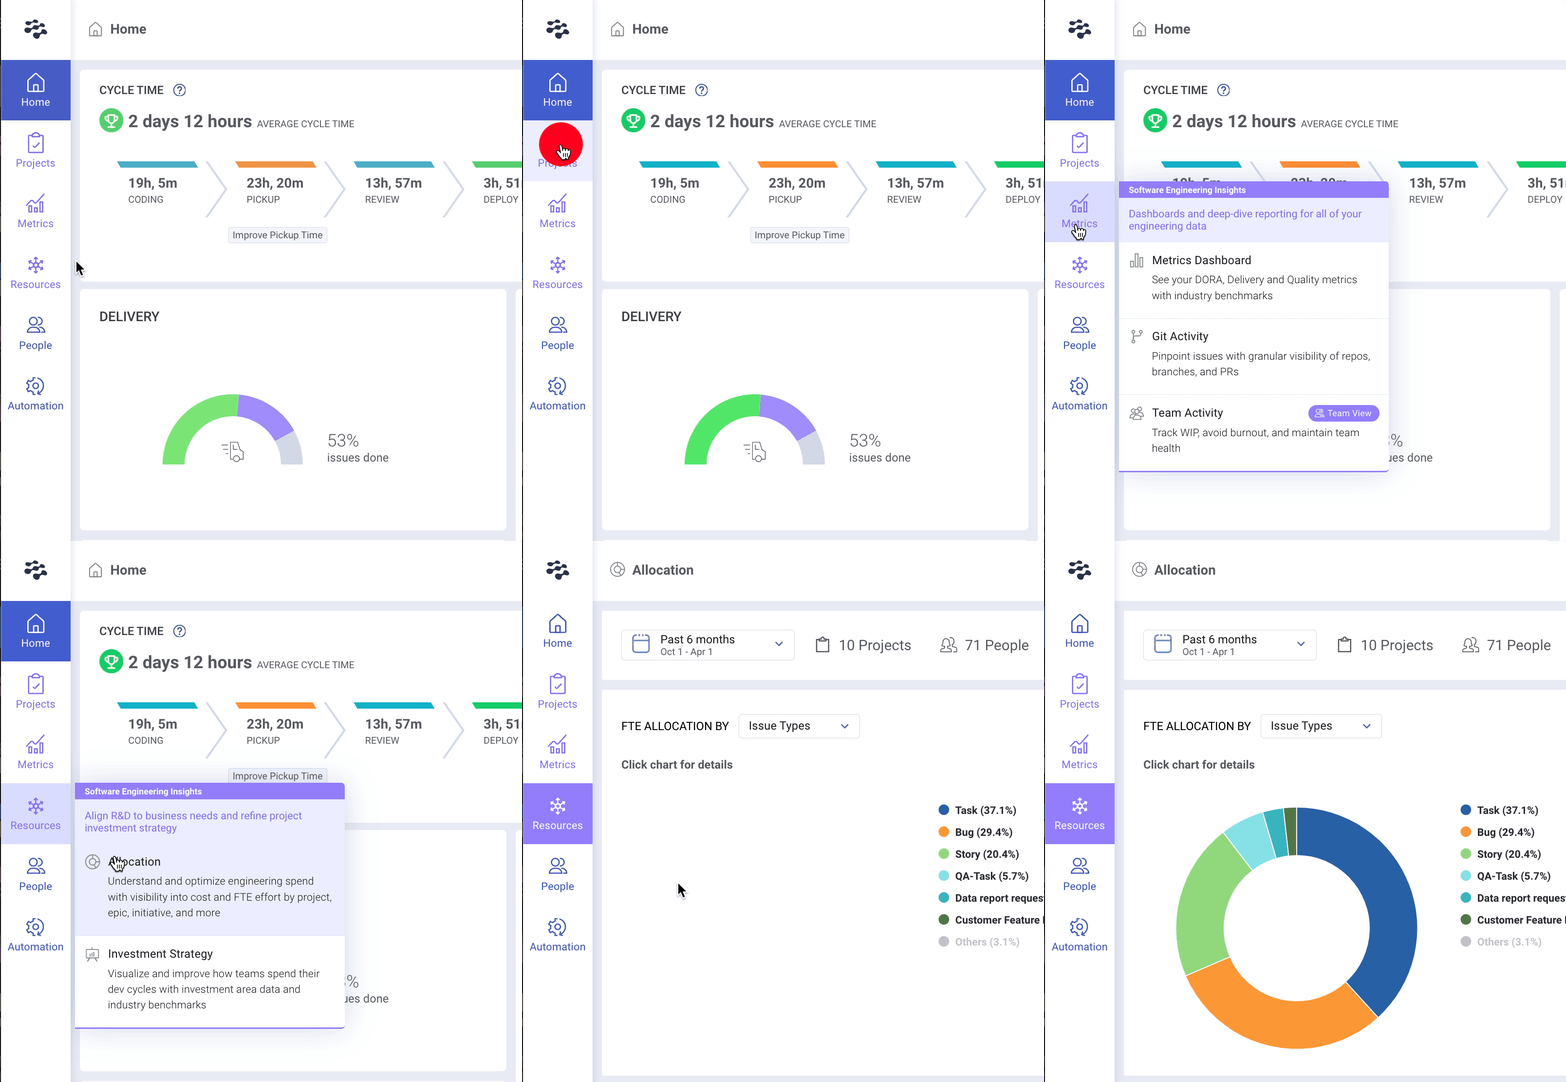
LinearB’s new navigation experience streamlines how you access key modules, views, and reports. All navigation elements are now conveniently grouped along the left sidebar, making it easier to locate features and move between tools.


Overview of Main Navigation Sections
Home
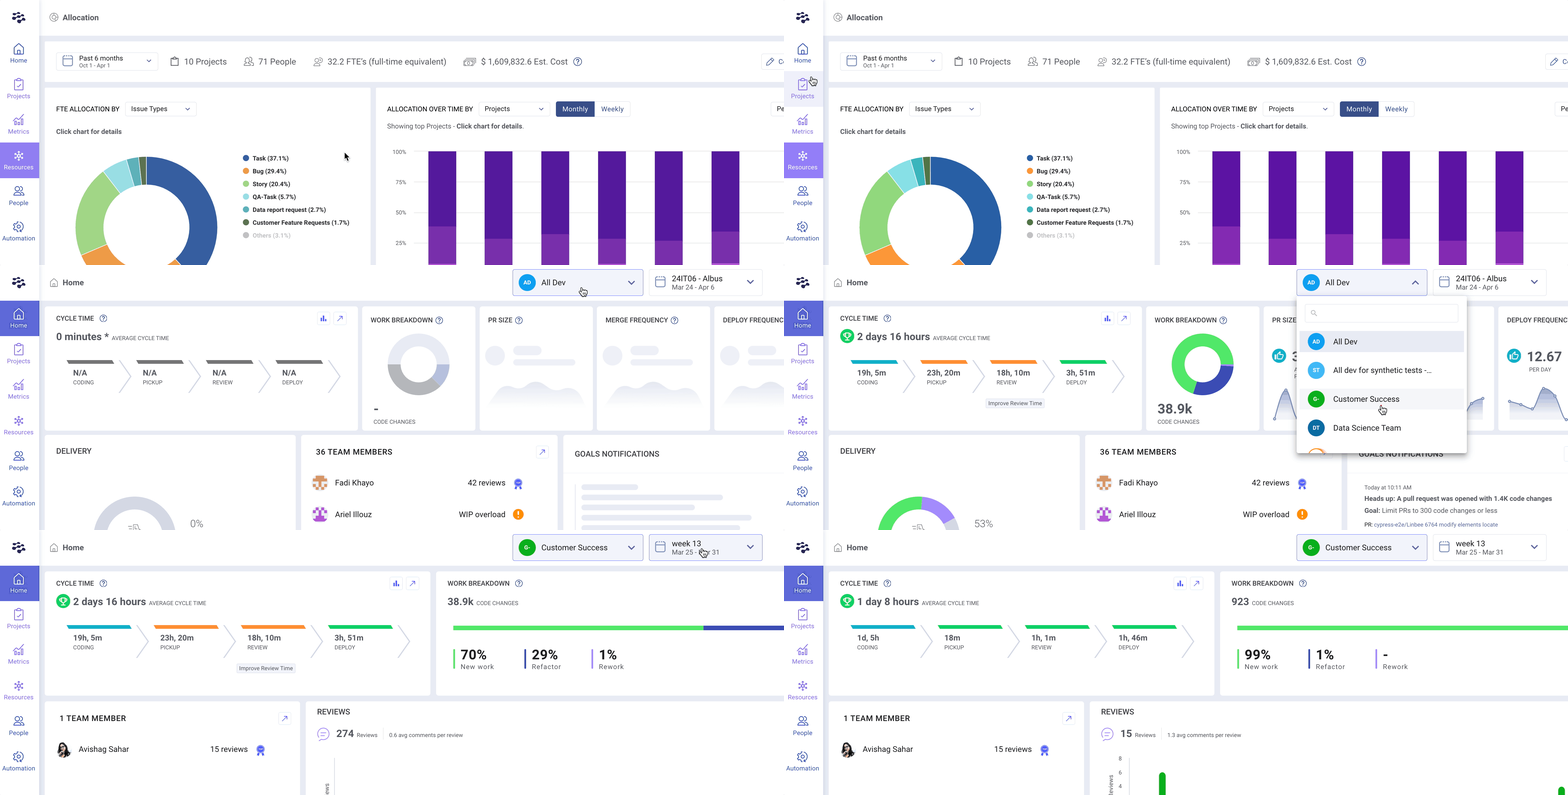
Access company-wide and team-specific dashboards. Easily switch between teams and time ranges from this central view.

Projects
Manage your project-related activities, including:
- Delivery – Create and track Project Delivery Trackers by team, project, or initiative.
- Pulse – Monitor real-time Git activity tied directly to PM issues.
- Forecasting – View reports to assess project trajectory and completion likelihood.
🔗 Learn more about Project Progression Forecasting
🔗 Understanding the Pulse View

Metrics
All your performance dashboards are here:
- Metrics Dashboard – View DORA metrics, Delivery, Quality, and Throughput reports. Create custom dashboards for team OKRs or weekly syncs.
- Git Activity – Formerly the Activity Tab, this view shows cycle time, work breakdown, release activity, and more.
- Team Activity – View top-level performance data across all teams.

Resources
Track how your teams invest their time and effort:
- Allocation – Understand where work is being spent across epics, issue types, and initiatives.
- Investment Strategy – Measure how much work contributes to innovation vs. maintenance.
🔗 Resource Allocation Overview
🔗 Investment Strategy Overview

People
Monitor team engagement and improvement initiatives:
- Goals – Set and track team-level improvement goals using data-driven insights.

Automation
Manage your gitStream automations:
- Automation Dashboard – View automation activity and impact across your repositories.
- Marketplace – Browse and adopt prebuilt gitStream workflows designed to streamline reviews and coding practices.
🔗 Visit the gitStream Marketplace

Feature Relocation Reference
Here’s where features from the old navigation structure can be found in the new layout:
Old Feature | New Location |
Activity | Metrics → Git Activity |
Team Activity | Metrics → Team Activity |
Goals | People → Goals |
Pulse | Projects → Pulse |
Project Delivery Trackers | Projects → Delivery |
Resource Allocation | Resources → Allocation |
Settings | Gear icon at the bottom-left of the sidebar |

Quick Access to Common Features
- Git Metrics: Metrics → Git Activity
- Team OKRs & Custom Dashboards: Metrics → Metrics Dashboard
- Release Tracking: Found under Git Activity → Releases
- Investment & Allocation Reports: Resources → Allocation / Investment Strategy
- Automation Control: Automation → Dashboard / Marketplace
How did we do?