Project Forecast in LinearB
Project Forecast in LinearB leverages Monte Carlo simulation to predict project completion timelines by analyzing historical data.

This data-driven approach enables teams to improve planning accuracy, optimize resource allocation, and mitigate project risks. By defining a project scope using Jira or Azure Boards, teams can generate probability-based forecasts displayed in an interactive, color-coded chart.

Accessing Project Forecast
- Navigate to the Projects tab in the LinearB Web Application.
- Click on the Forecasting tab.
- Select the Forecast sub-tab to access the simulation results.
If no projects have been created yet, click Add Filter to define the project scope by selecting Jira projects, Initiatives, Epics, or Azure Boards Epics, Features, and Tags.
For detailed guidance, refer to Saving Filter Sets and Projects.

Setting Up a Forecast
To ensure accurate predictions, the selected project scope must meet the following conditions:
- Minimum of 30 Issues: The dataset should contain at least 30 minimum issues to provide statistically meaningful results.
- Recent Completion History: The system requires at least 5 weeks of completed issues to model realistic trends.
- Fixed Scope: The forecast is optimized for fixed-scope projects with defined completion goals. Forecasting may be inaccurate for ongoing workstreams such as maintenance or support tasks.
Best Practice: Choose a set of active Jira Epics or Azure Boards Features currently in progress.

Understanding Forecasting Results
Monte Carlo Simulation and Probability-Based Forecasting
Monte Carlo simulation is a statistical modeling technique that runs thousands of simulations to estimate possible completion outcomes. Instead of providing a single completion date, it generates a range of probabilities for different completion timeframes.
Graphical Representations of Predictions
LinearB presents forecasting results in three visual formats:
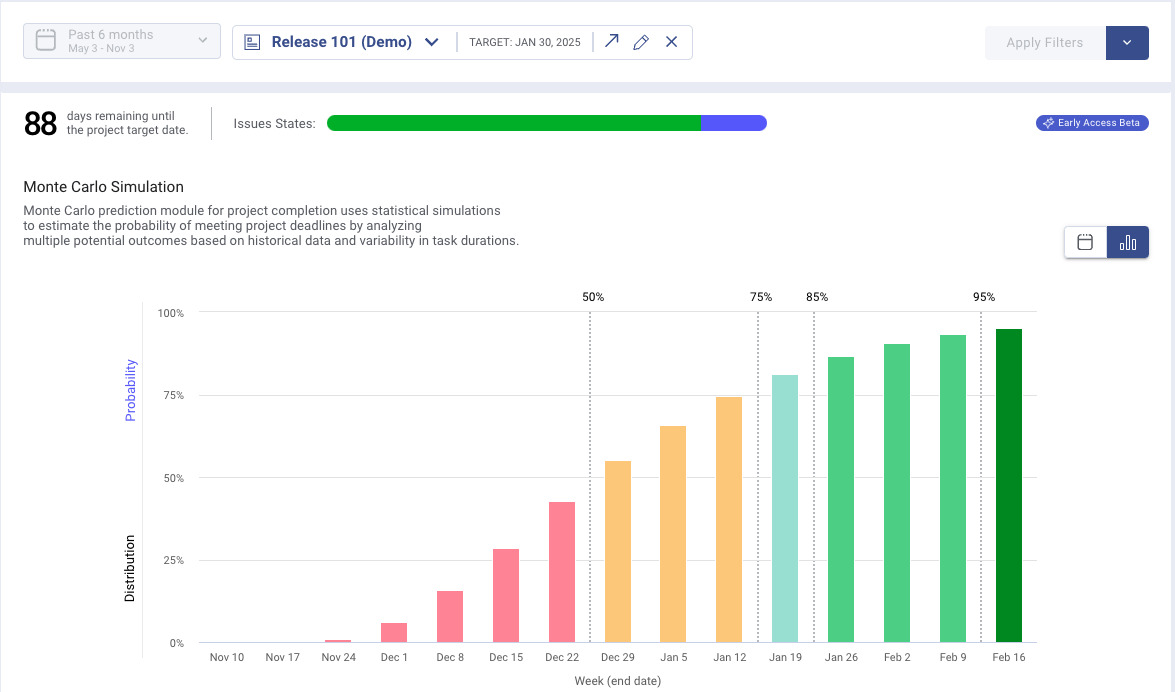
1. Default Weekly Probability Chart
- Displays weekly completion probabilities for upcoming weeks.
- Color-coded probability bars:
- Red (≤50%): Low confidence of on-time completion.
- Yellow (51–74%): Moderate likelihood of completion.
- Green (≥95%): High confidence in completion.
- Taller bars indicate a higher probability of project completion in that week.
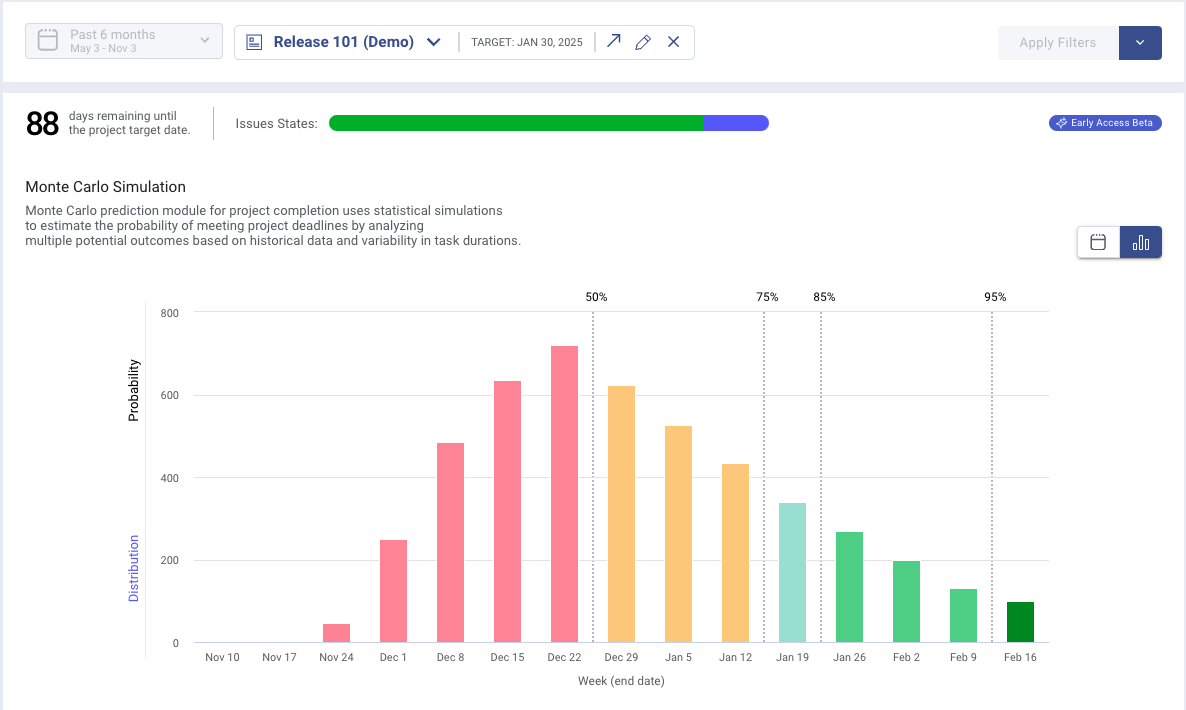
2. Distribution Graph (Bell Curve)
- Familiar Monte Carlo-style histogram displaying probable completion dates.
- The tallest green columns indicate the most likely completion weeks.
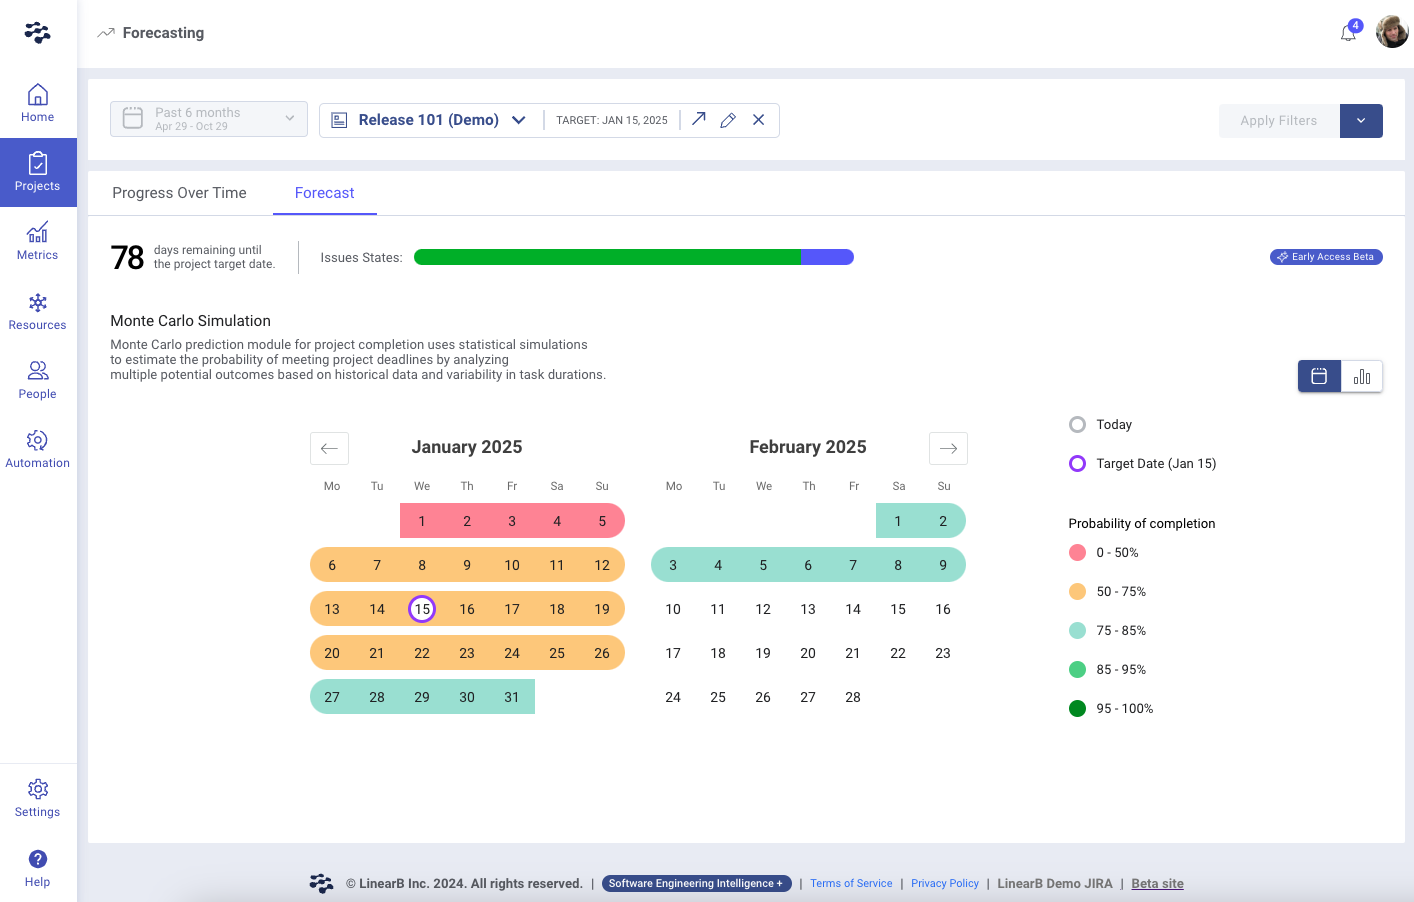
- Markers highlight confidence levels at 50%, 75%, 85%, and 95% probability.
- Switch to this view by clicking Distribution on the Y-axis.
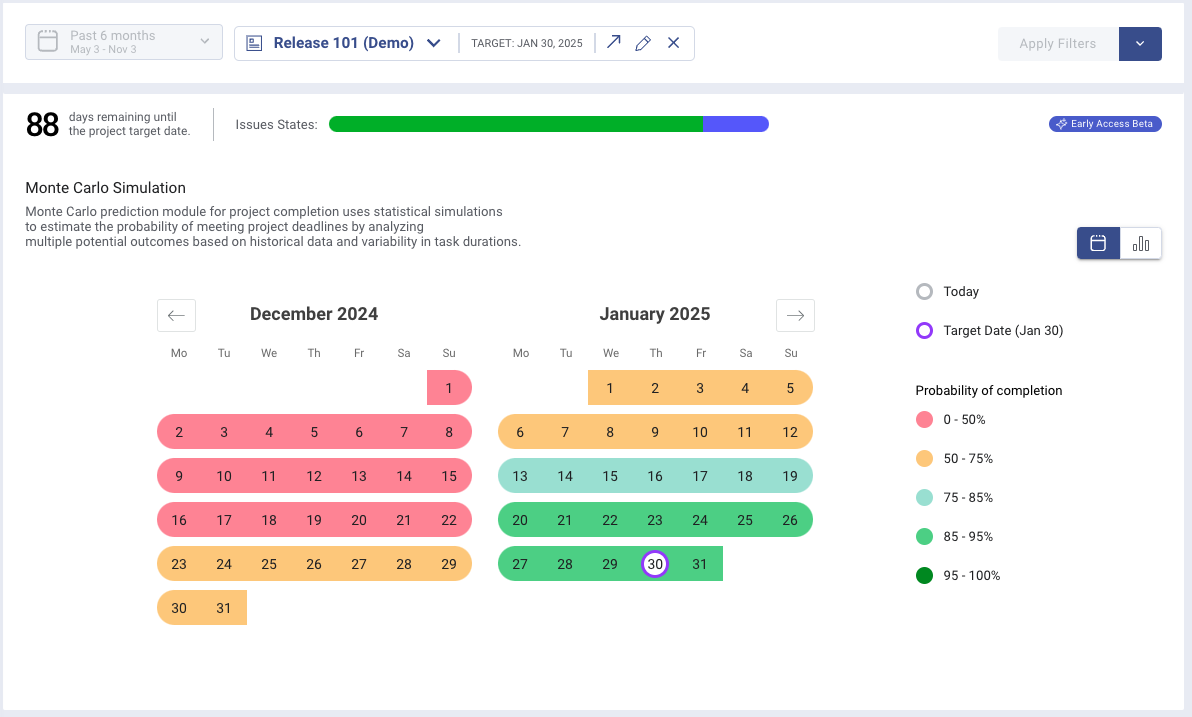
3. Calendar View
- Provides an intuitive calendar-based forecast.
- Weeks are color-coded from red to green, showing the probability of completion.
- Navigate between months and review projected success rates.
- Access by clicking the Calendar tab in the top-right.

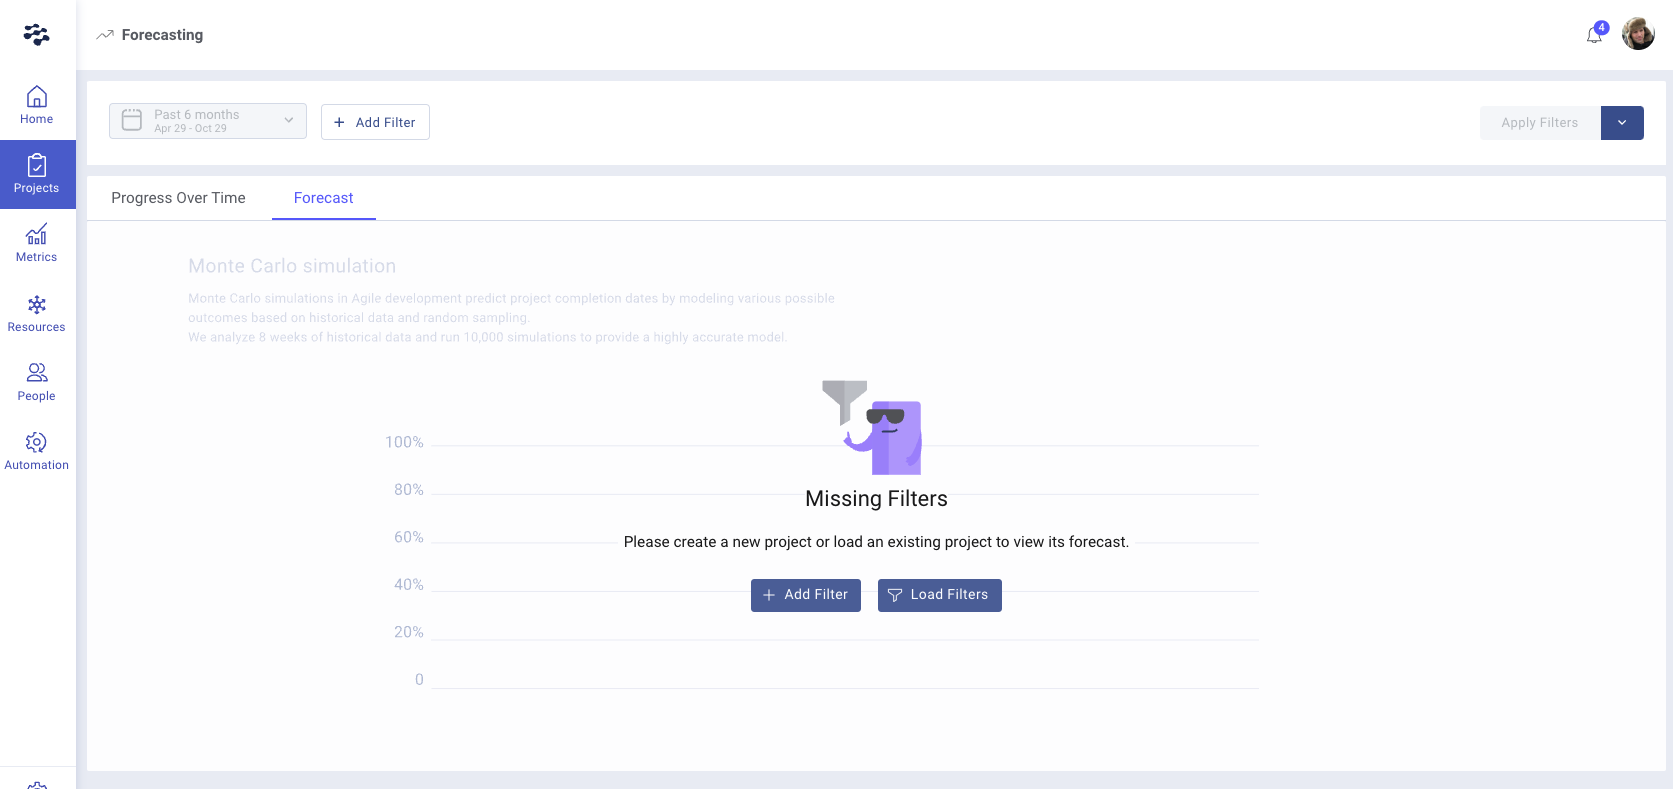
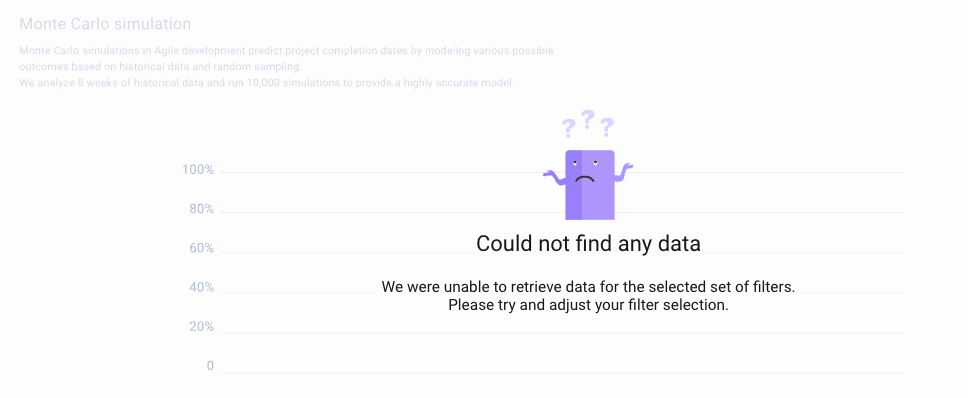
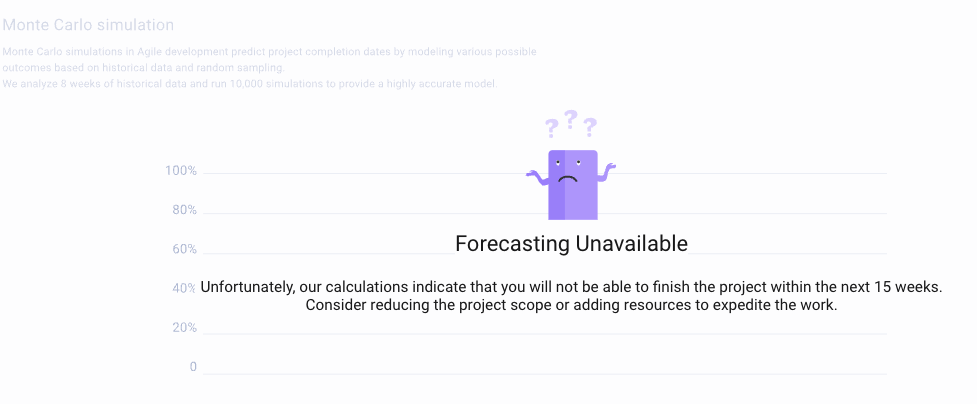
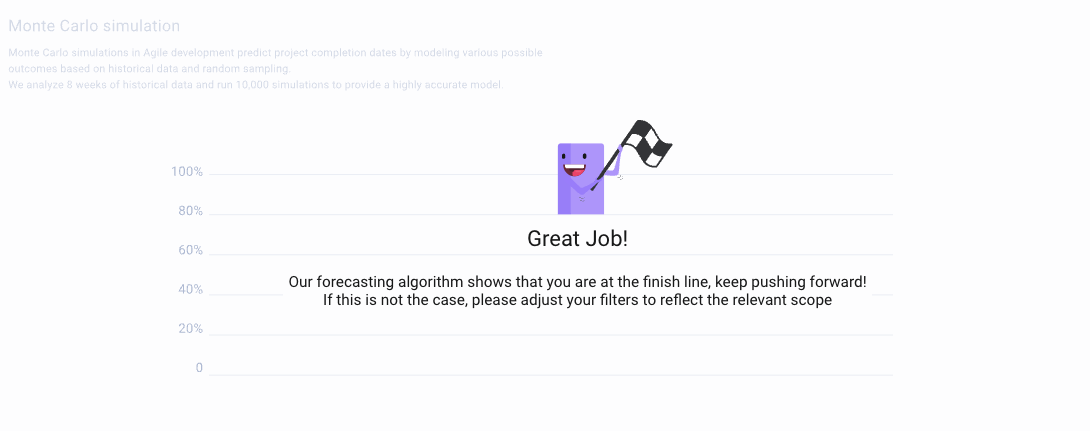
Handling Errors and Empty States
If meaningful results cannot be generated, an empty state message appears with troubleshooting guidance.
Common reasons forecasts may fail:
- Insufficient historical data: If the selected project has too few completed issues in the past 6 weeks, results cannot be calculated.
- Unrealistically low completion probability: If there is less than a 3% chance of completing within 15 weeks, the system will display a “Forecasting Unavailable” message.
- Project Completion: If 95% of issues in the project are marked as Done, the system will display a ‘Great Job!’completion message instead of a forecast.

Data Update Frequency
- Forecast Data: Updated daily at 4:30 AM UTC.

Related Features & Resources
- Progress Over Time in LinearB – Track project trends and efficiency.
- Understanding Project Delivery Trackers – Learn how to assess and monitor project health.
- Using Project Filters – Optimize tracking with custom filter sets.
For further assistance, contact support@linearb.io or visit our Help Center.
How did we do?
Project Delivery Tracker: Issue Count vs. Story Points Done
Team Iterations & AI Iteration Summary