Table of Contents
Resource Allocation (old)
What is Resource Allocation? Resource Allocation helps ensure your resources are aligned with your business priorities. In this report, developer effort on issues types, projects, epics, and/or initi…

What is Resource Allocation?
Resource Allocation helps ensure your resources are aligned with your business priorities. In this report, developer effort on issues types, projects, epics, and/or initiatives is broken down to help determine where your development resources are being applied.
What is FTE and how is it calculated?
FTE stands for "Full-Time Equivalent". This is a unit used to represent the workload of a full-time employee in a given period of time. For example, two workers spending half of their time on a project for a month would be tallied as one FTE for that month. This metric is used to understand the amount of work invested in a project or a task, normalizing it to full-time headcount. FTE is calculated by summing the number of work days invested in a project over a period of time, and dividing it by the number of days in that period.
- The reporting period is important: For example, the amount of work equivalent to 6 FTEs in a single month would be equivalent to 2 FTEs in a quarter.
- This can be seen in scenarios where a team sprints on an epic for one iteration, then moves on to a different project.
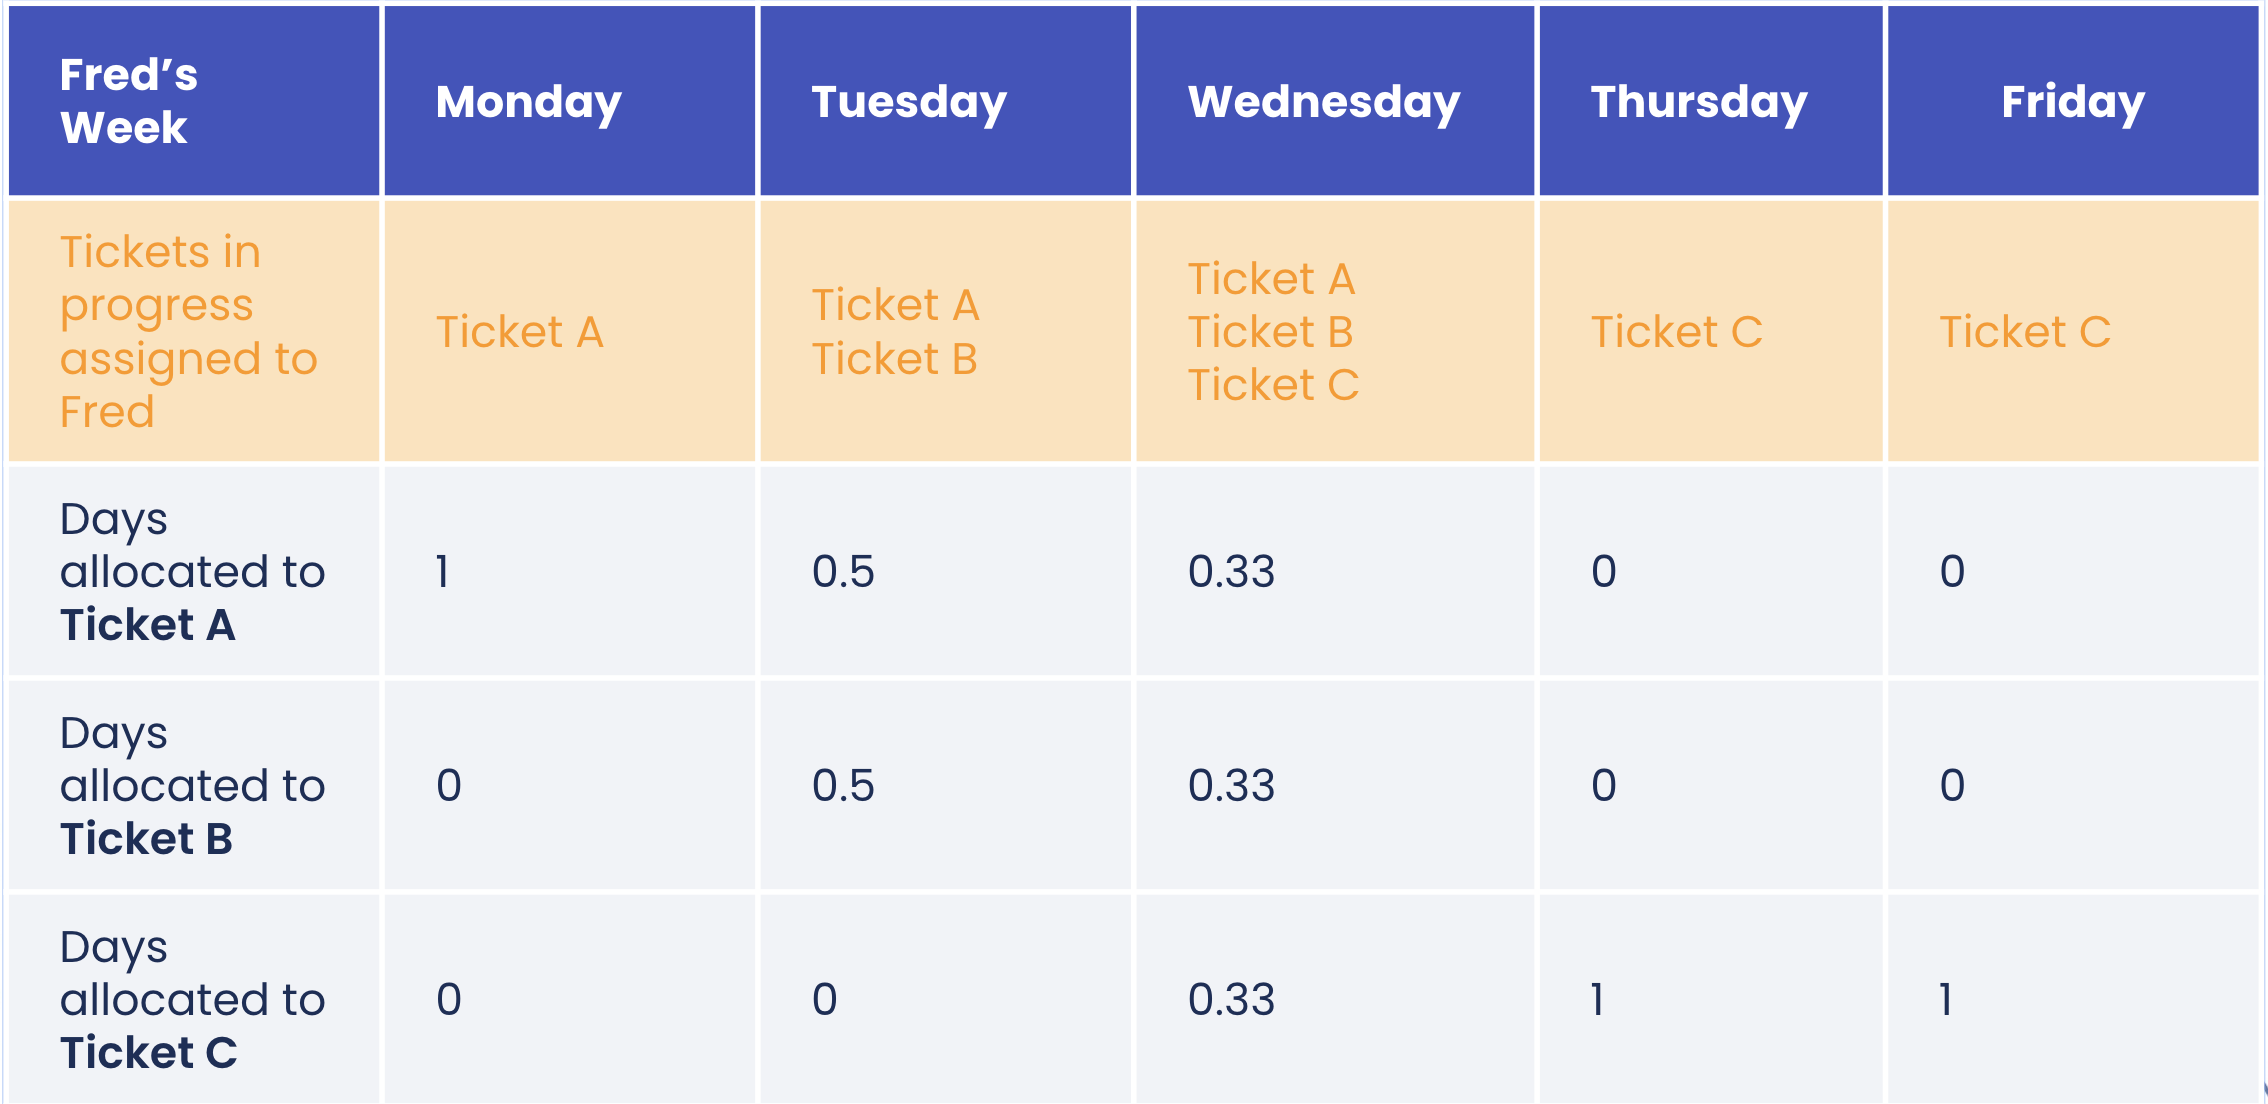
- 1 FTE could represent the work of multiple developers. Teams of developers could be working on multiple initiatives concurrently. If developers are splitting their workday between multiple issues, LinearB will devote a portion of each developer's day to the worked-upon issues and sum these portions of effort to determine the FTE devoted to each specific issue.
Note in the below graph of "Fred's" workweek. On days when Fred works on multiple issues, the full-time equivalent of Fred's work is divided between all issues worked.
Reporting Tour
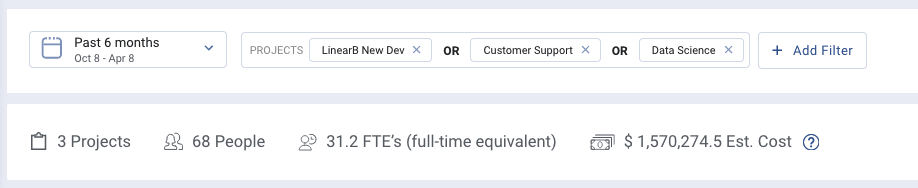
Navigate to the Resource Allocation report by clicking on the Projects Tab and selecting Resource Allocation. The top of your page will include the following: a date picker, the number of PM projects LinearB is reporting over, the number of unique contributors working on these projects, and the full-time equivalent(FTE) of this effort.
Use the date picker to select which time-range you wish to see, LinearB will automatically update metrics and calculations for the entire page as dates are changed.
Allocation Over Time
The allocation over time graph will allow you to see your organization's effort broken out by project, initiative, epic, issue type, label, or custom fields (Jira) or by or project, work item type, epic, feature, tag, or custom fields (Azure Boards).
Click on the labels at the bottom of a graph to refine which segments are visible.
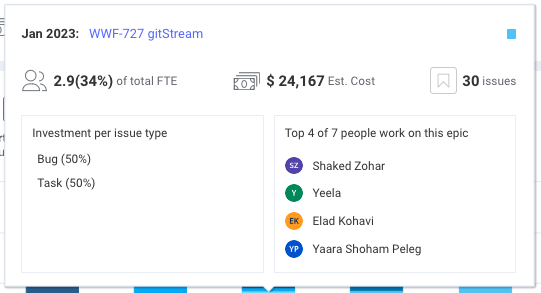
Click on any segment inside this graph to see a detail breakdown of effort invested in this item for the specific month or week displayed. The detail window will include a breakdown of the issue types found in this project, the top contributors for this segment of work, and also the FTE as a number, a percent of the total FTEs summed for that specific week or month, as well as a cost estimate of the resources working on this segment.
Work Unit Breakdown
A list breakdown of the work units LinearB is scanning can be found on the lower half of your resource allocation report. Filter this view using the date picker at the top of your resource allocation report, and by clicking on the list filters ("Initiatives", "Projects", etc.).
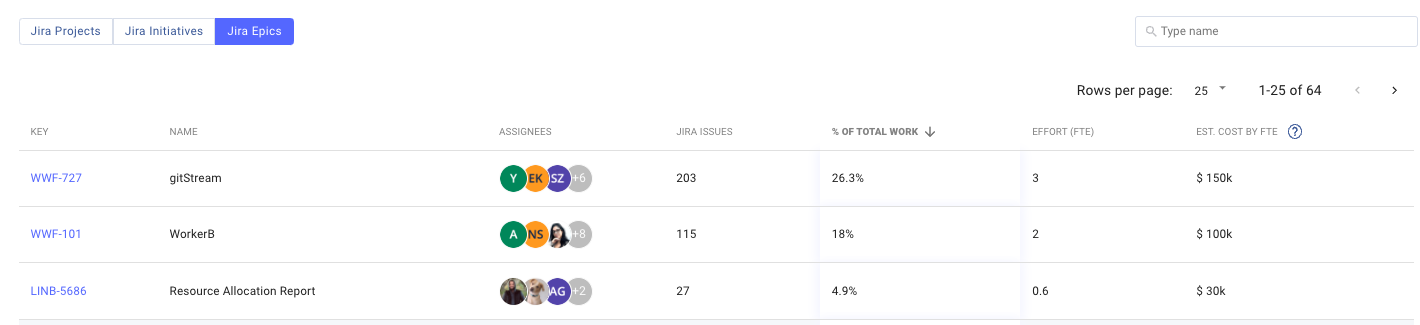
The filtered views will contain the below metrics:
Epics/Issues
The count of epics or issues active during this date range. When filtering this list by initiatives or projects, you will see an epics count. When filtering by epics, a count of active issues will be displayed.
% of Total Work
This is the percent of all FTEs for this time.
Effort (FTE)
The sum of FTEs for all issues/epics which were active during this time.
Estimated Cost by FTE
Estimated cost applies the average salary per employee to the FTE number for your projects/epics/issue types. This will show the estimated cost of employee resources working on your initiatives during the time period you are viewing.
Issues With No Epics
When using the Projects filter, this will give a count of issues which are not currently linked to any epics. This is an indicator of work that is currently unaccounted for in your resource allocation report.
FTE Allocation by Issue Type
This graph displays breakdown of all issues which were active during your set date range, and what percent of your organizations resources were dedicated to each issue type. Set the date range using the date picker at the top of the resource allocation page to see your resource investment in specific types of issues.
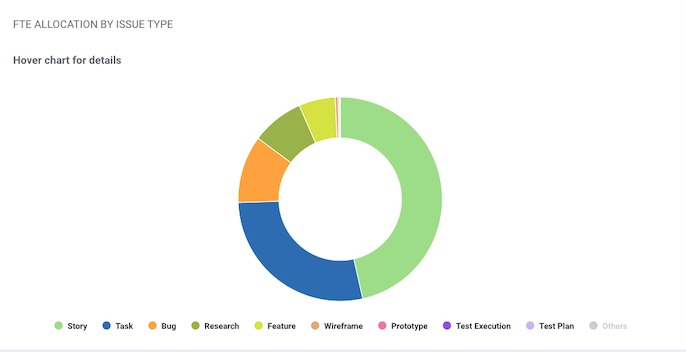
This can be helpful in identifying if your team resources are being directed into development tasks, or if bugs or other issues could be pulling your team away from delivering on initiatives.
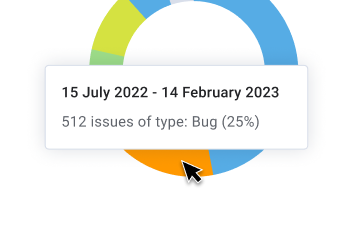
Click on any portion of this graph to see what percent of your FTE is being dedicated to each issue type.
How do I configure my resource allocation report?
The resource allocation dashboard will automatically gather data from all boards and projects synced with LinearB. You can edit which projects and boards LinearB is scanning by going to Company Settings -> Project management -> Projects.
Configure Report
In order to customize the ways in which data can be shown on your report, click the Configure button on the top right of the page. From there, you can select which options exist for data breakdowns in the main Resource Allocation charts:
- Projects
- Issue Types (Jira only)
- Work Item Types (Azure Boards only)
- Initiatives (Jira only)
- Epics
- Features (Azure Boards only)
- Fields (Azure Boards) or Custom Fields (Jira)
- Tags (Azure Boards) or Labels (Jira)
If one of the options available to you is not relevant to your work breakdown (you don't use Epics, for example), you can uncheck it to remove it as a breakdown option.
Filtering report
By default, the report will show all of your company's work in the specified time frame. To filter this down to work from individual teams or projects, use the filter options next to the date dropdown. You can add new filter criteria by clicking "add filter":
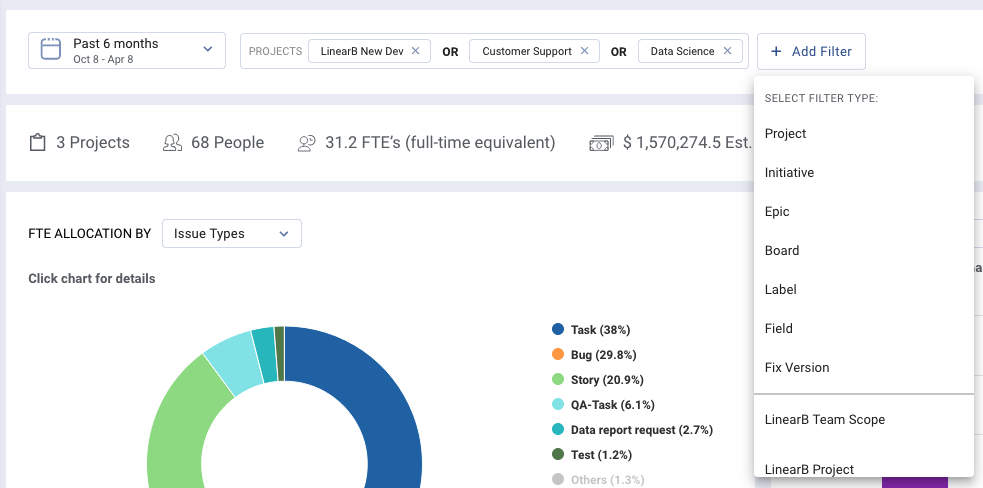
On the drop down, you will see the built-in Project Management filters as well as the option to select custom fields/fields and tags/labels.
In addition to the Project Management filters, you will see two additional options: LinearB Team Scope and LinearB Project. LinearB Team Scope looks at work associated with a Team as configured in the Team's settings in the Iterations tab. For example, if the Frontend Development team is configured like this:
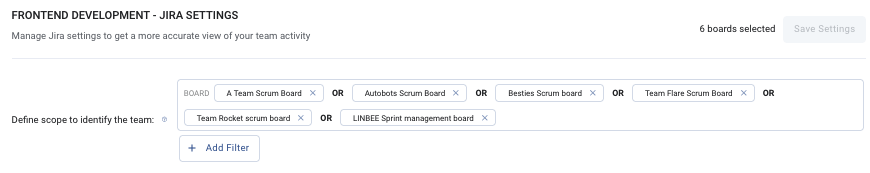
Adding their Team Scope to the filter will limit the report to only work on the six boards specified above.
The Project option will allow you to select a previously-configured PDT project, and limit work to that specific scope. For more information on how to configure these projects, please see How to Create and Edit LinearB Project Delivery Trackers.
Configuring your FTE estimated cost
The estimated cost of an FTE allows you to apply your average salary per employee to the FTE number for your projects/epics/issue types. To edit this value, click on the  button in the top right of your page.
Best Practices for Utilizing Resource Allocation
For the resource allocation report to provide the best results, your development team should consistently be using issue assignment (e.g., devs work on issues assigned to them), and should be using issue statuses to mark an issue as "in progress" (custom statuses are supported, as long as they map to the "in progress" status category).
Recommended workflows and automations:
- Robust assignment rules
- Rules and automations which help development teams keep issues assigned to the developer currently working on a task.
- Robust "in progress" rules
- Rules and automations to ensure developers mark issues they're currently working on with an "in progress" status.
Frequently Asked Questions
How do we know if an issue was active?
LinearB determines if an issues is "active" on a given day in one of two ways:
- The issue is in a "in progress" status on the relevant day, and also has activity such as ticket status changes or git activity on linked branches on that day or the preceeding 7 days. If no activity is detected on an "in progress" issue for 7 days, the issue will not be allocated or counted as being worked on by LinearB.
- The issues is not in a "in progress" status, but activity is detected on this issue. We look at git activity related to the issue (in linked git branches), as well as changes made to the issue itself. If activity is detected the issues is allocated and counted as being worked on for that time.
I see more contributors than FTEs in my report.
Essentially, there should always be more people than FTEs. Team members will take vacations, people get sick, and some developers may work part-time or spend certain days working on non-coding tasks. Until we are fully assimilated by the Borg, it's reasonable to expect a difference between developer count and the FTE calculated.
How frequently does this dashboard update?
Resource Allocation updates daily, and will not show data from the current day.
Data will be updated every day at 6:30am UTC and will also be updated after changes in the configuration are saved.
How did we do?