SEI Automations Marketplace and Dashboard
SEI Automations are available for GitHub Cloud, GitHub Enterprise, and GitLab Cloud. More code hosts are in the works! With SEI Automations (formerly gitStream), your team can enable automated action…

With SEI Automations (formerly gitStream), your team can enable automated actions for their PRs and MRs. This allows you to do things like:
- Auto-label PRs based on how much time they'll take to review
- Auto-assign PRs to the person who knows the most about that area of the code, without maintaining a CODEOWNERS file
- Enforce naming your branches in a particular way
Unlike a CI/CD pipeline, SEI Automations is focused on human interactions with the code. With SEI automations in place, you can implement lots of helpful little changes to make things run more smoothly in your development and code review process, bringing down your cycle time and improving your DORA metrics. You can read more in the overview page of the SEI Automations docs, including how to install SEI Automations in your code host.
SEI Automations Marketplace
The SEI Automations marketplace is where your team can view available automations for your code. To open it, go to the main menu, then select Automation > Marketplace.
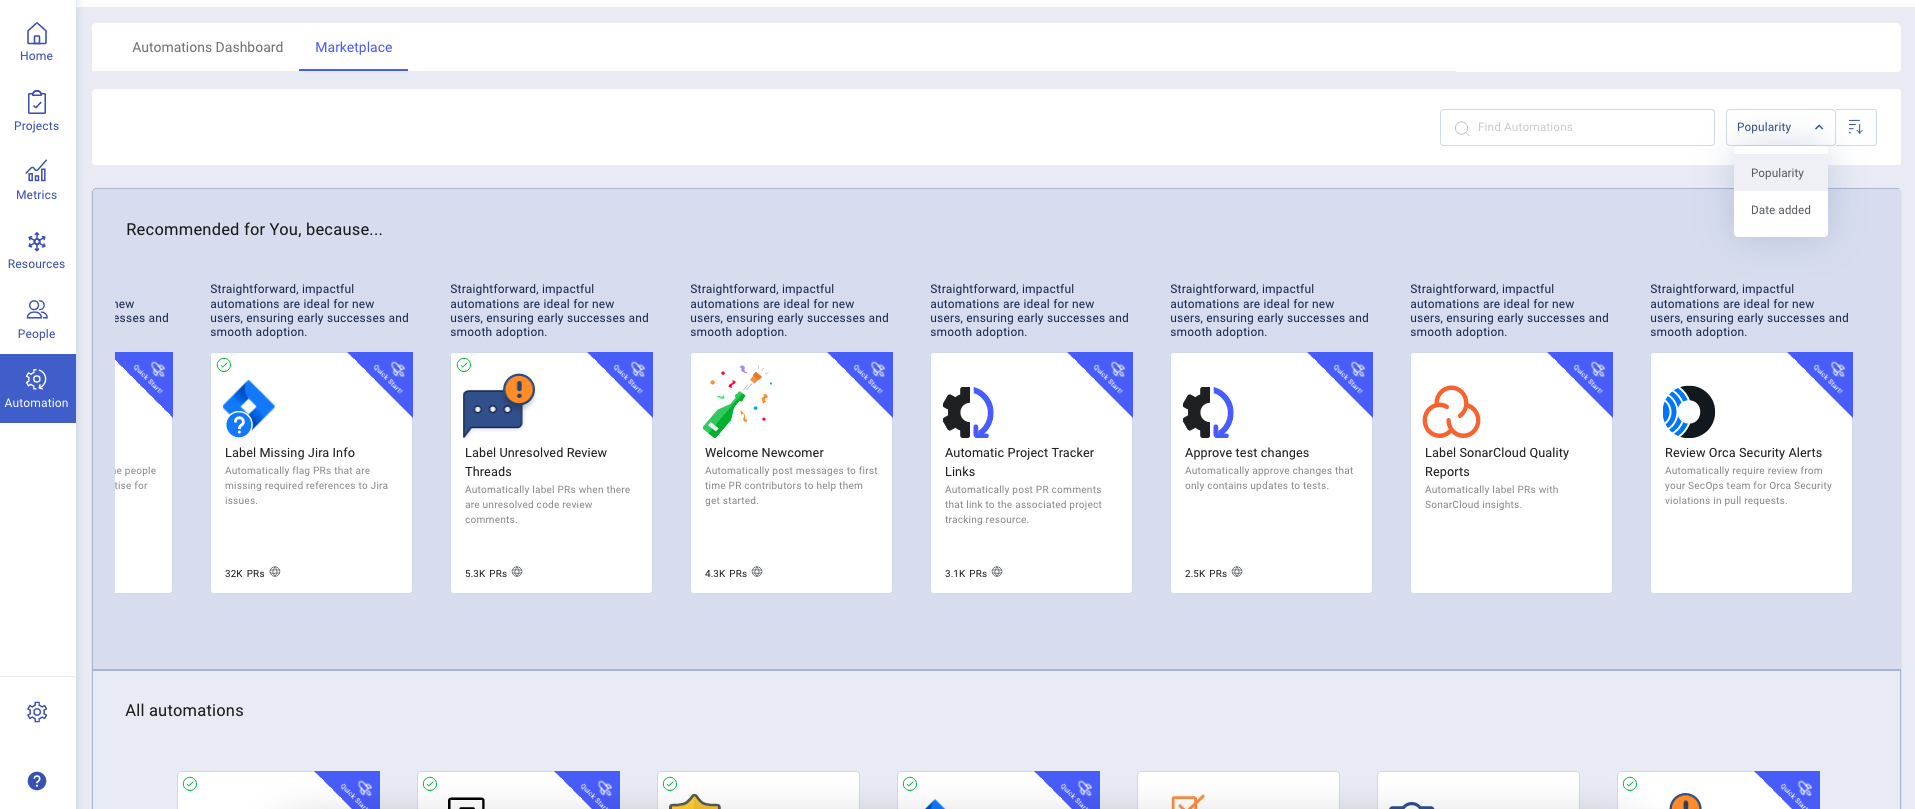
At the top of the Marketplace, you'll view a list of recommended Automations. Click on them to open the instructions for implementing that particular Automation. Because Automations are managed via easy-to-modify YAML files, you can use any existing Automation as a base template for other Automations, as well.
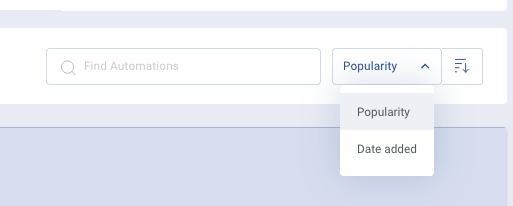
Beneath the Recommended Automations, you'll see all pre-built Automation templates. You can search them using the Find Automations search bar, and sort by Popularity or Date Added:
SEI Automations Dashboard
The Automations Dashboard is where you'll be able to see information on the impact of your Automations. To open the Dashboard, navigate to Automation > Automations Dashboard from the main menu.
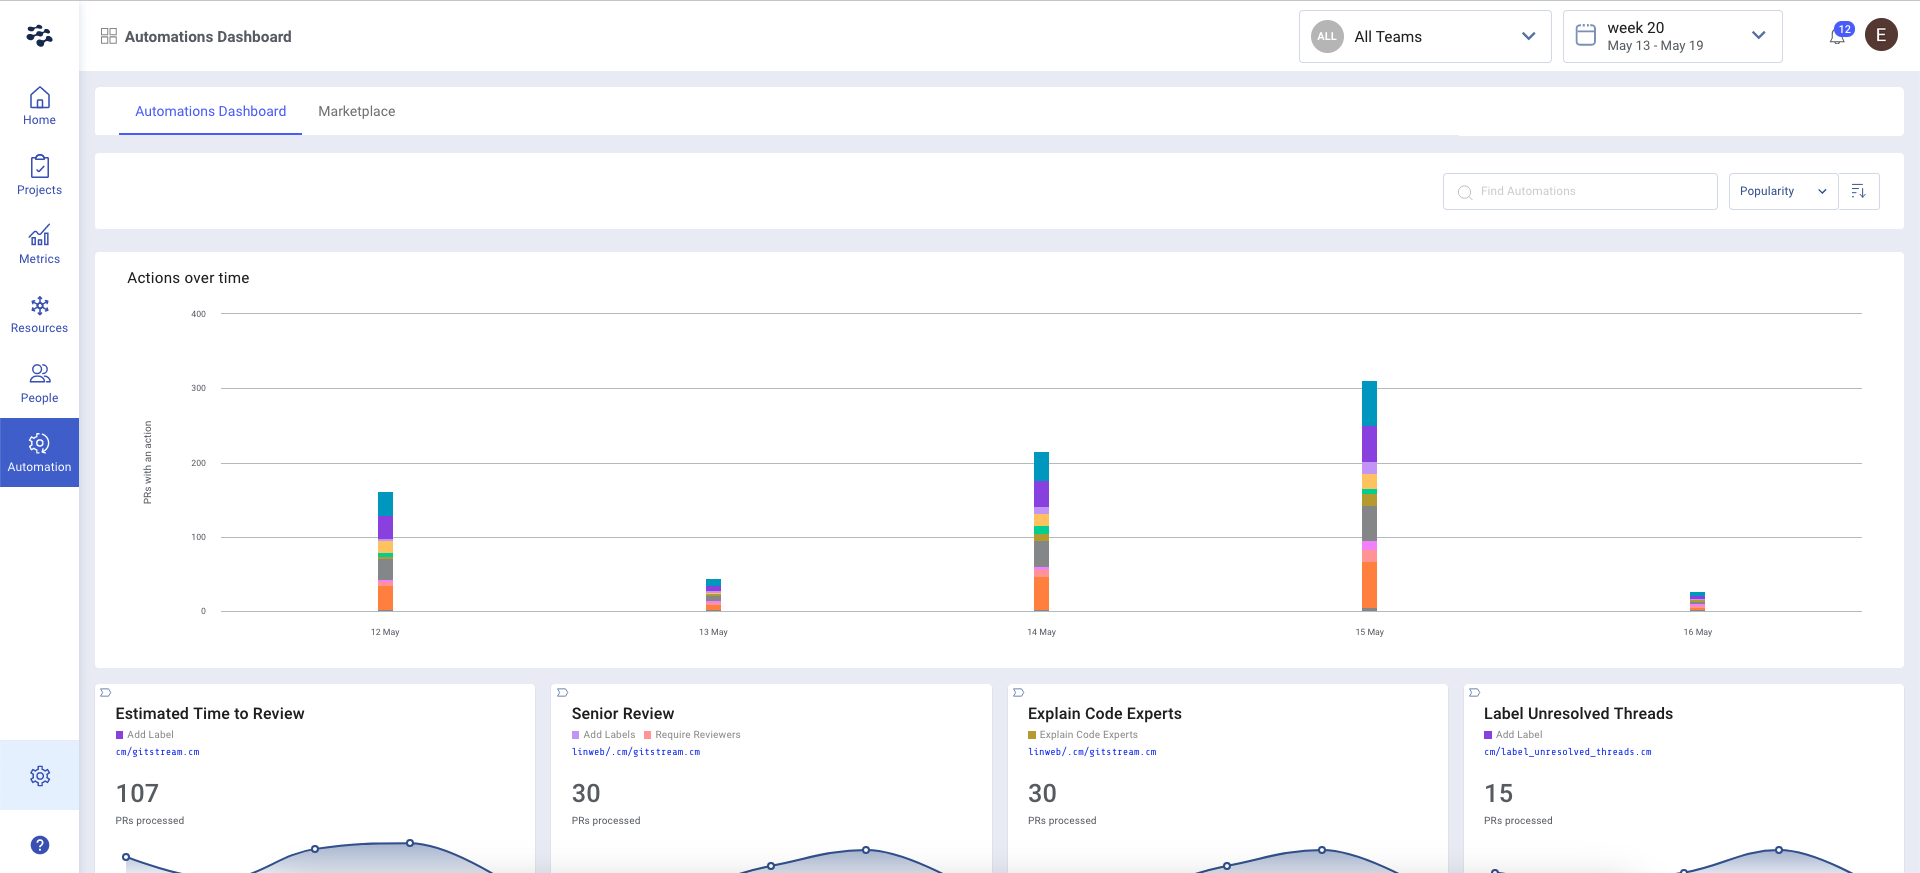
By default, the graph at the top of the page will show the number of unique PRs where an automation has taken action over the period of time you have selected in the date menu, with the colors representing different actions taken by the automation.
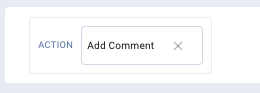
Click on the action you're interested in to limit the data to just that action. You can remove the Action filter by clicking the x next to it above the graph:
To adjust the timeframe for the graph, use the date drop-down in the top right of the page. When you select the new date range, the page will refresh and the graph will update to show data for that time period.
If you wish to see just some automations, you can search in the Find Automations toolbar. Once you type your query, press enter, and the data will adjust to show only matching automations.
Individual automation data
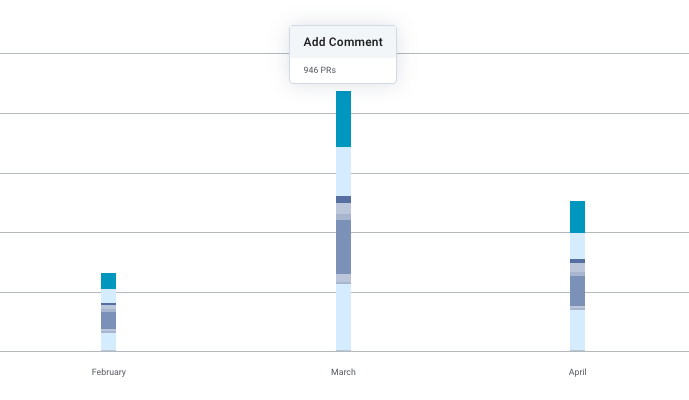
Beneath the main graph, you'll see data for each automation you have running:
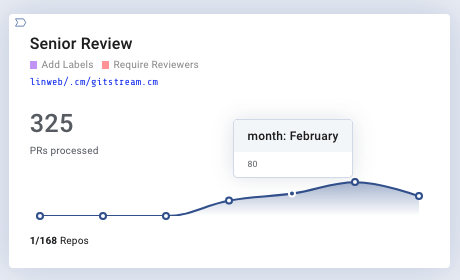
Beneath the name of the automation, you'll see the action(s) that the automation takes. (In this example, adding labels and requiring reviewers.) Clicking on the action name will filter the main graph and all of the per-automation graphs to show just that action.
On the left, you'll see the number of unique PRs the automation has been applied to in the time frame selected on the page. Hovering over any individual data point will show the number of unique PRs the automation ran on in that month or week (for shorter timeframes). At the bottom, you will see how many repos the automation is active in of the repos you are syncing to LinearB.
Common questions
Why do I see more actions than I have unique PRs?
The numbers in the graph record the number of unique PRs each specific action applied to. So, if an automation applies multiple actions to a single PR, each action will be represented. This can lead to higher numbers than you might anticipate, but is an accurate reflection of the actions the automations are taking.
Why do I see merge actions but no merged PRs in my code?
You will see a merge action in the graph if your PR matched the criteria for an automated merge, and SEI automations attempted to merge the code. However, the merge may still fail due to your CI/CD criteria, or may simply take longer than expected due to checks, which can mean the actual merge you see in your code host is delayed.
How did we do?