Table of Contents
Developer Metrics
The Developer Metrics Dashboard provides a unified view of developer activity over a selected timeframe, ensuring a balanced focus on both coding contributions and reviewing others' work.

The Developer Metrics insights help teams maintain healthy engineering practices, track individual and team performance, and identify opportunities for improvement.

Viewing the Development Metrics
- In the LinearB side menu, click Teams > Coaching.
- Select a team and timeframe from the top of the page.
- Select the team member whose metric you wish to view.

Understanding Developer Metrics
Developer metrics provide visibility into individual, team, and organization-wide activity, allowing leaders to:
✅ Recognize high-performing contributors.
✅ Identify workload imbalances.
✅ Improve collaboration between submitters and reviewers
Each metric is designed to help teams track trends, measure impact, and support data-driven discussions about engineering productivity.
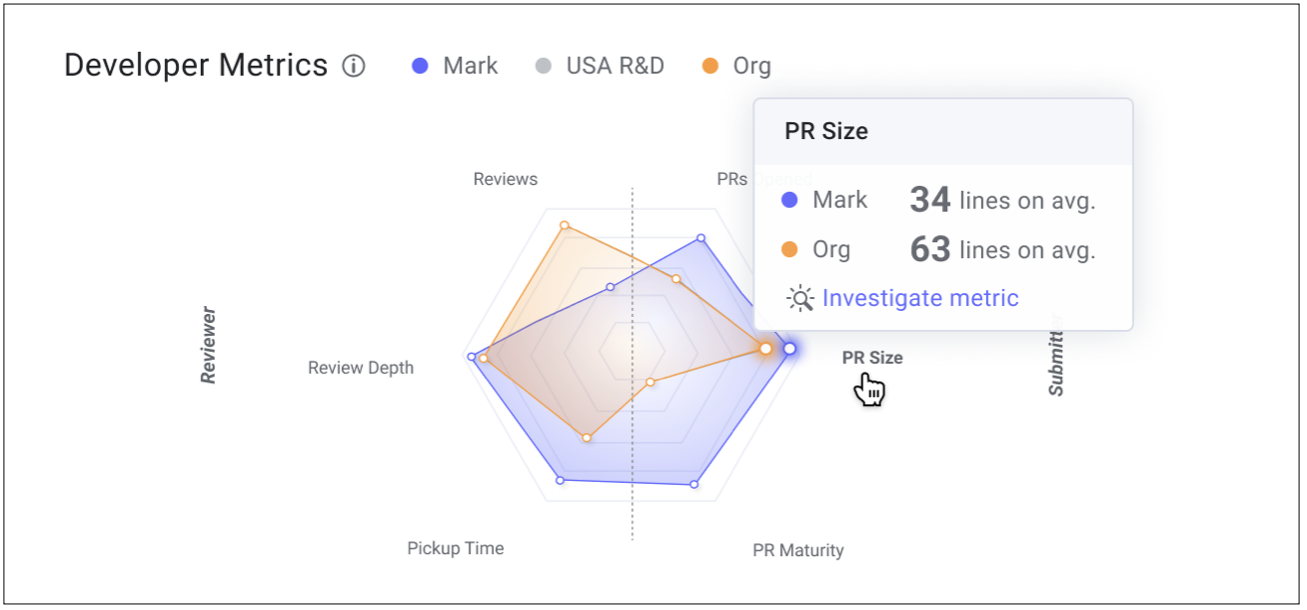
Graph Interpretation:
- Metrics are visualized in a radial graph, where proximity to the perimeter indicates positive trends.
- The expected distribution varies by role and seniority:
- Junior developers tend to have more coding time and PRs opened.
- Senior developers or architects often focus more on code reviews and technical mentorship.
- Use these insights for balanced workload distribution and effective performance discussions.
Metrics Calculation: These values use KPIs from the Metrics Dashboard and reflect the Metrics Calculation method selected in Company Settings.

Reviewer Metrics
1. Reviews Conducted
Measures the number of PR reviews completed by the developer.
- Junior developers may have fewer reviews but should still participate regularly to improve their code quality and collaboration skills.
- Senior developers often conduct more reviews, ensuring code consistency and mentoring.
2. Review Depth
Measures the thoroughness of code reviews, based on:
- PR size – Larger PRs generally require more in-depth review.
- Number of comments added – More comments indicate detailed feedback.
Why It Matters:
- Thoughtful reviews help catch errors early, reducing rework.
- Review depth can signal a developer’s engagement in the review process.
3. Pickup Time
Tracks how quickly PRs are reviewed after being created or assigned.
- Faster pickup times lead to shorter cycle times and higher deployment frequency.
- Long pickup times can indicate review bottlenecks or lack of reviewer availability.
✅ How to Improve Pickup Time:
- Assign PR reviewers early.
- Use automation tools to flag PRs that need attention.
- Set team goals for reducing pickup delays.

Submitter Metrics
4. PRs Opened
Tracks the number of pull requests submitted by a developer within a timeframe.
- A steady flow of PRs indicates consistent progress.
- Monitor work in progress (WIP) and working days metrics to prevent burnout.
5. PR Size
Measures the average lines of code changed per PR.
- Smaller PRs:
✅ Picked up faster.
✅ Reviewed more thoroughly.
✅ Result in lower cycle time and higher deployment frequency.
- Larger PRs:
May be delayed in review and increase change failure rates (CFR).
6. PR Maturity
Evaluates the level of collaboration between submitters and reviewers.
- Tracks the "back and forth" interactions on PRs, including:
✅ Comments and review cycles.
✅ Requested changes before approval.
✅ Additional commits made after initial review.
Improving PR Maturity:
- Submit well-documented PRs with clear context and estimated review time.
- Assign PRs to the right reviewers based on expertise.
- Use automation (e.g., SEI + Automation) to optimize PR assignments and approvals.

Why Use Developer Metrics in LinearB?
✅ Track individual and team performance – Gain visibility into contributions, reviews, and collaboration patterns.
✅ Identify coaching opportunities – Support developer growth and mentorship.
✅ Balance workload distribution – Prevent burnout and inefficiencies.
✅ Optimize PR workflows – Improve review processes, pickup times, and PR maturity.
By leveraging Developer Metrics in LinearB, teams can foster a more efficient, collaborative, and high-performing engineering culture.

Related Resources
🔗 Development Experience (DevEx) Metrics
How did we do?
Developer Coaching Overview
Development Experience (DevEx) Metrics in LinearB