Table of Contents
Developer Coaching Overview
Get deep, actionable insights into each developer’s workflow, habits, and wellness—and coach smarter with Developer Coaching.

LinearB’s Developer Coaching dashboard gives engineering leaders deep visibility into an individual developer’s workflow, coding patterns, pull request habits, and workload distribution. This insight helps you coach effectively, balance effort across your teams, and improve overall developer experience (DevEx).

Navigating the Developer Coaching Dashboard
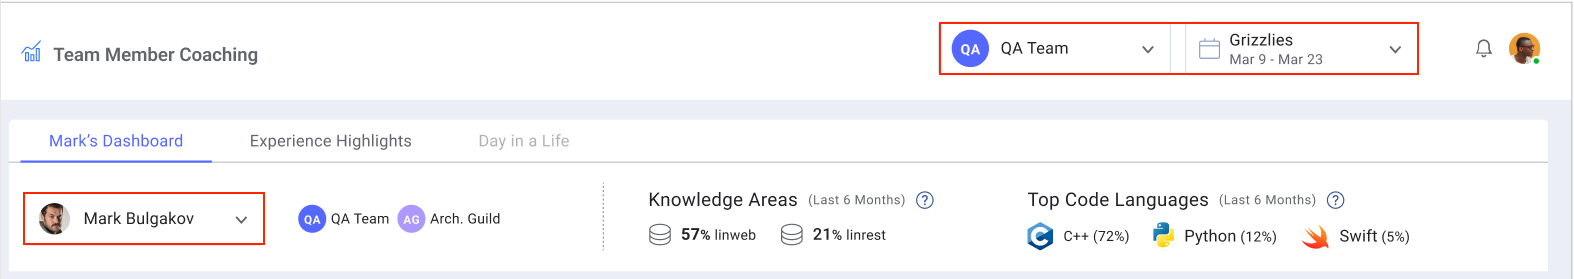
To access the dashboard, go to Teams > Coaching. Use the filters at the top of the screen to customize your view:
- Developer selector (left side)—Use the dropdown menu on the left to choose a developer.
- Team selector (right side)—Limits the dropdown list to members of the selected team.
- Date range picker (right side)—Adjusts the reporting period for the displayed insights.

1. [Developer's Name] Dashboard (Default View)
This view includes:
- Developer Profile Overview
- Knowledge Areas
- Top Coding Languages
- Development Experience
- Wellness Workload
- Developer Metrics
- Top 5 Completed Items
All data is scoped to the selected developer, team, and time period.

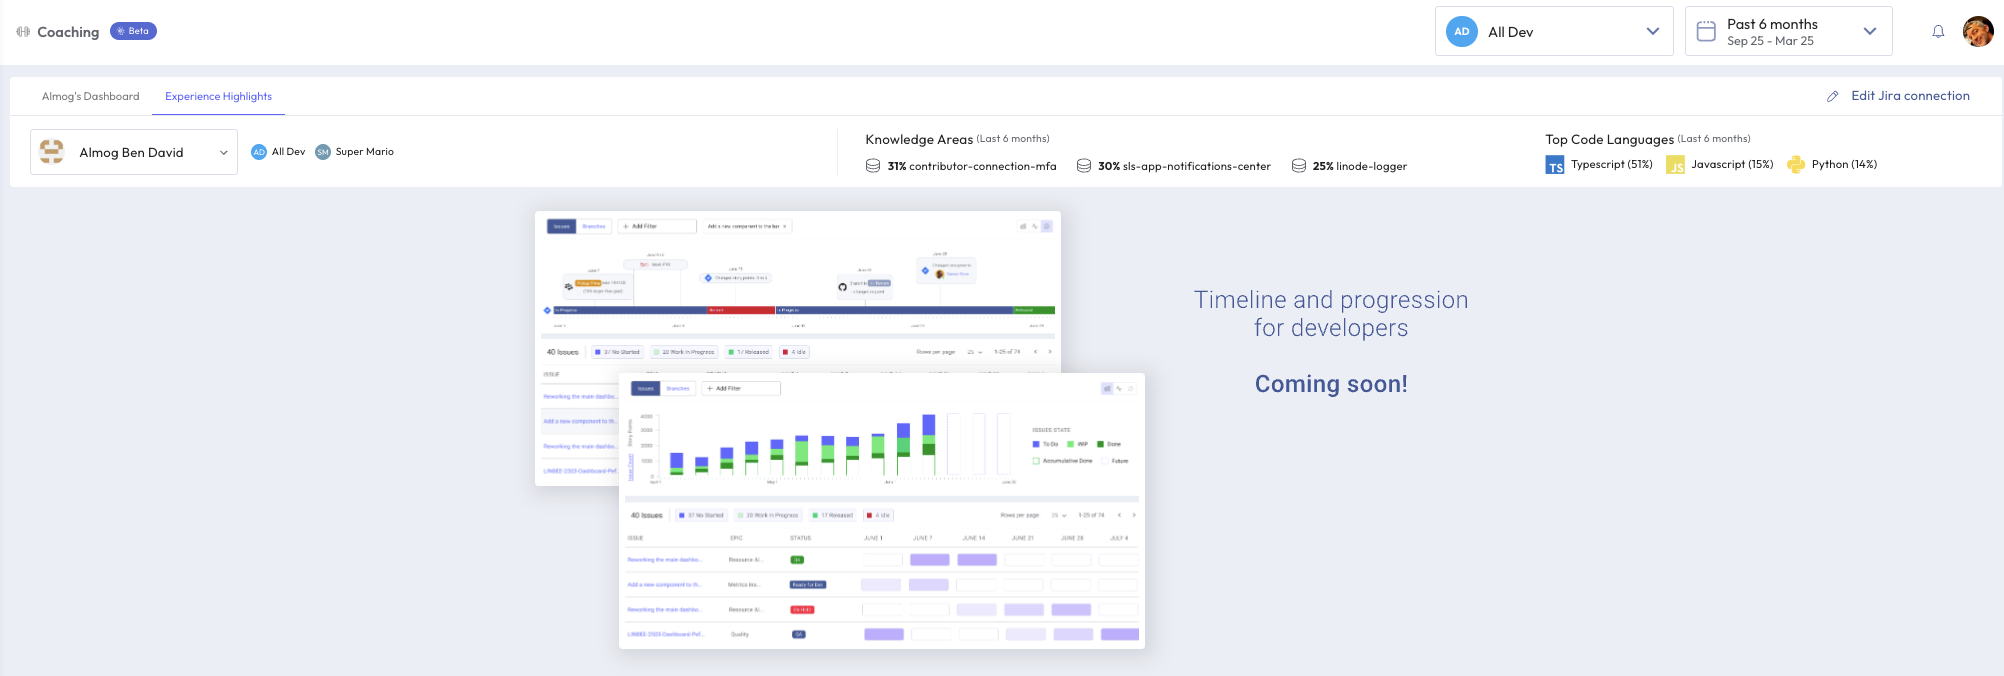
2. Experience Highlights
Currently in development. This tab will provide timeline-based insights into a developer's progression across sprints, highlighting major trends and coaching opportunities.

Developer Profile Overview
Located alongside to the developer’s name, this section includes:
- Teams they contribute to in LinearB
- Repositories they actively work on
- Programming Languages they use most frequently
This snapshot helps you understand the developer’s work context at a glance.


Knowledge Areas
This section highlights the top 3 repositories the developer contributed to in the last 6 months. Repositories are ranked by developer engagement, including pull requests (PRs) and code reviews. Only repositories where developers performed 10% or more of their work appear.
Use this to:
- Identify knowledge islands
- View where specific developers have concentrated their efforts
- Manage expertise distribution
- Promote better collaboration and knowledge sharing

Top Coding Languages
This section analyzes the programming languages used in merged PRs over the past six months. For each language, it calculates the percentage of lines written relative to the total lines of code across all merged PRs authored by the developer. File patterns that are excluded in the repository settings are respected, and only languages representing more than 10% of total usage are displayed.
Icons are included for each programming language to enhance visual recognition and quick scanning.
Use this view to:
- Understand a developer’s expertise and focus areas based on their most-used languages
- Detect imbalances between frontend and backend contributions, ensuring a more balanced distribution
- Track adoption of new technologies, such as shifts from JavaScript to TypeScript
- Identify opportunities for growth or pairing based on current strengths
- Optimize team assignments based on developer expertise
By leveraging these metrics, managers can assess skill distribution, encourage cross-training, and ensure developers are working in areas that align with both team goals and personal growth.

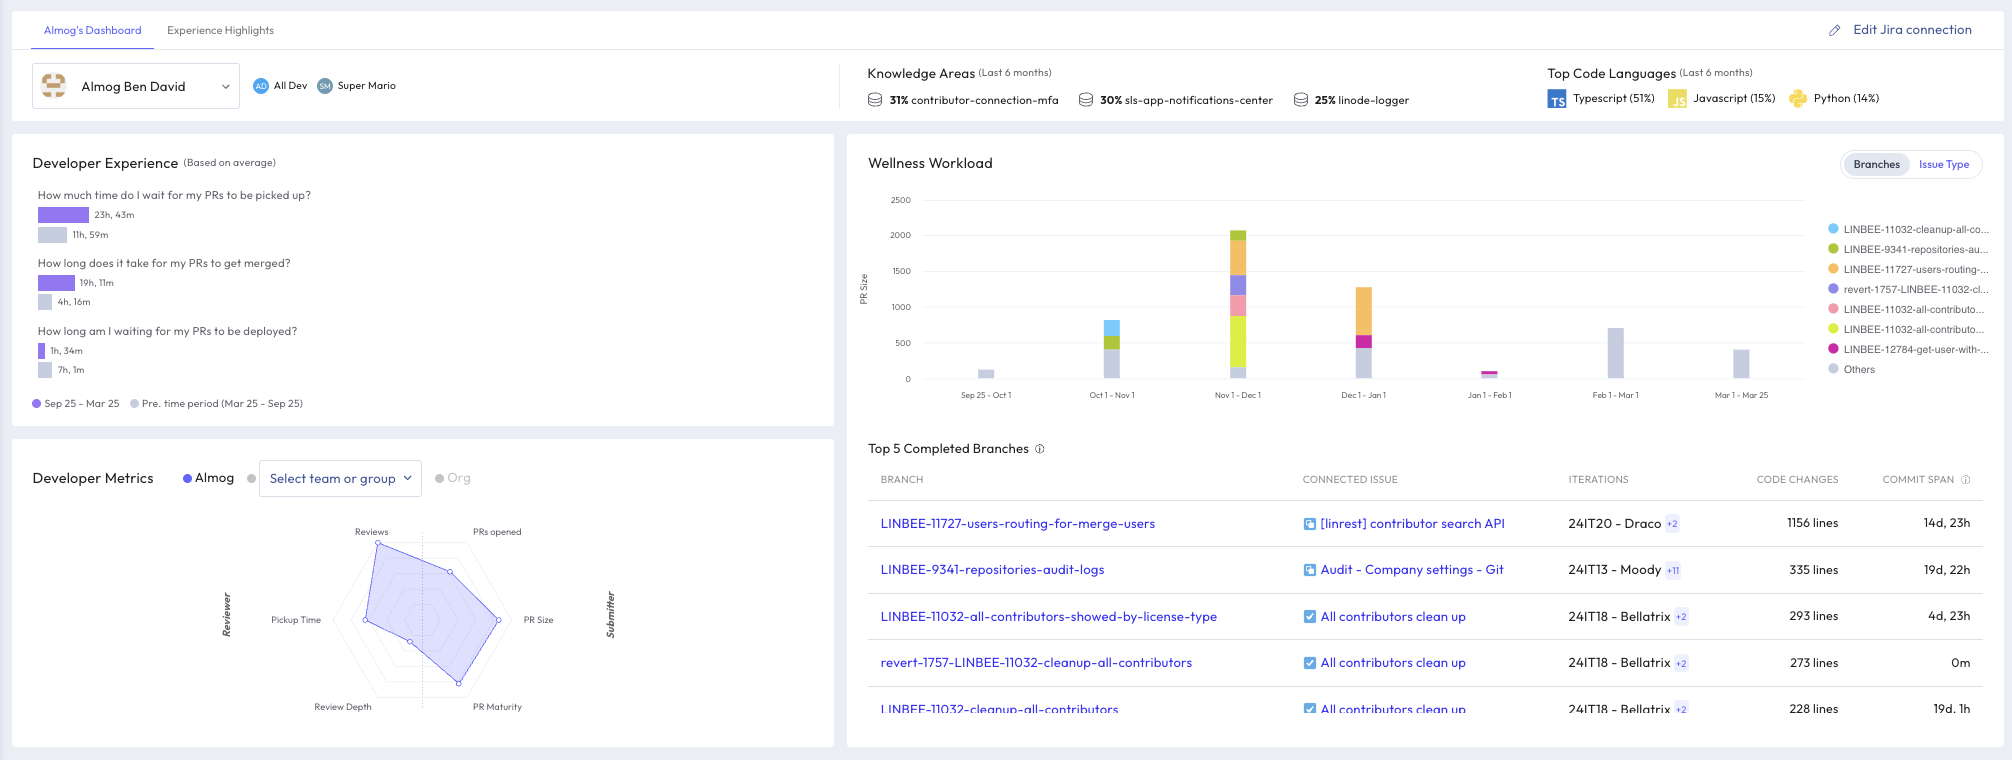
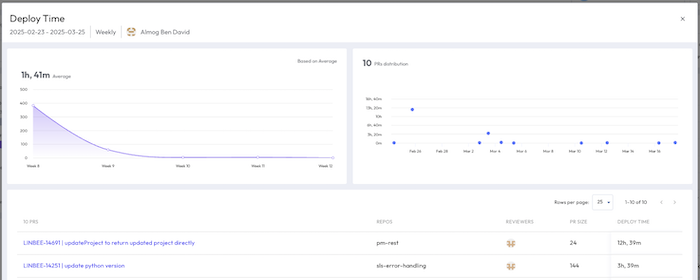
Development Experience
This section shows how long, on average, it takes for a developer's PRs to:
- Be picked up for review—the duration PRs remained idle before being picked up.
- Be merged into the main branch—the time PRs spent waiting before being merged.
- Be deployed to production—the delay between merging and deploying the code.
Values are shown in comparison to the previous time period in grey.
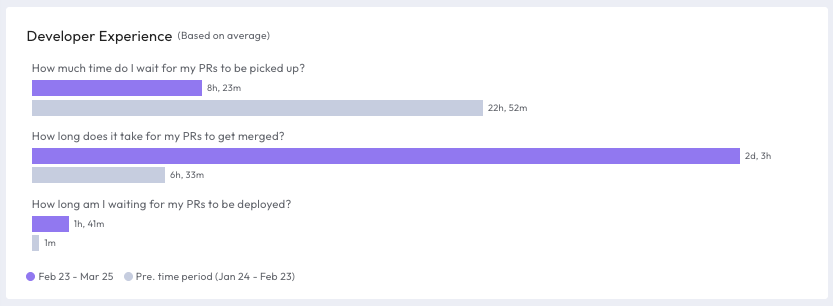
Clicking on any of the three questions opens a detailed modal window that shows:
- Daily trend graphs
- PR distribution
- Individual PR details including repo, reviewer, PR size, and time to merge/deploy
Use this to identify blockers or track improvements in PR workflow. High values may indicate delays in team collaboration or CI/CD bottlenecks.

Wellness Workload
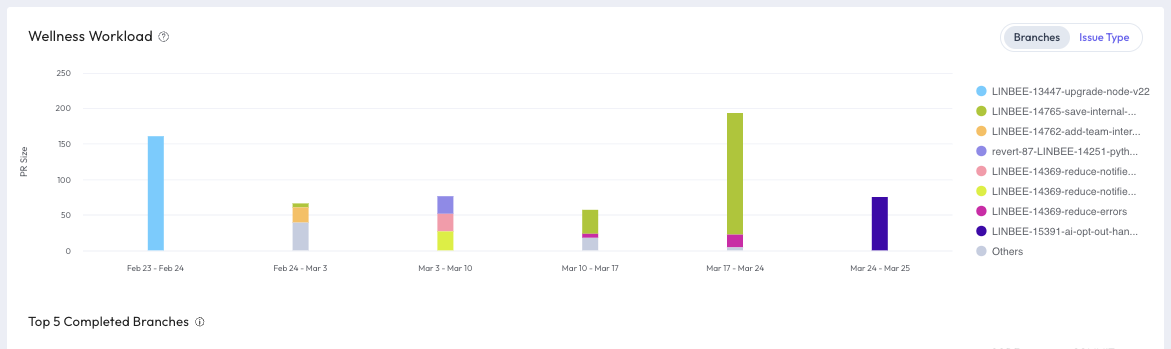
The Wellness Workload section offers a comprehensive view of a developer’s workload from two perspectives:
- Branch (default view)
- Issue Type (selectable via toggle button)
Use it to:
- Understand how a developer’s workload is distributed across the selected time range and whether the developer's pull requests are appropriately sized.
- Assess if PRs are being split into manageable chunks
- Explore if heavy workloads are due to sprint intensity or poor story breakdown
- Prompt coaching conversations around PR hygiene
Key Questions for Analysis:
- Are tasks broken into small, reviewable PRs, or are developers submitting large, complex PRs?
- Is the developer experiencing a temporary workload spike, or is this a recurring pattern?
- Should the team establish PR size best practices or set team-wide goals around PR structure?

Switching Between Workload Perspectives
Users can toggle between Branches mode and Issue Type mode to analyze different aspects of a developer’s work distribution.
Branches Mode
- Displays the number of branches worked on, broken down by week or month.
- Offers insights into code activity levels and development effort.
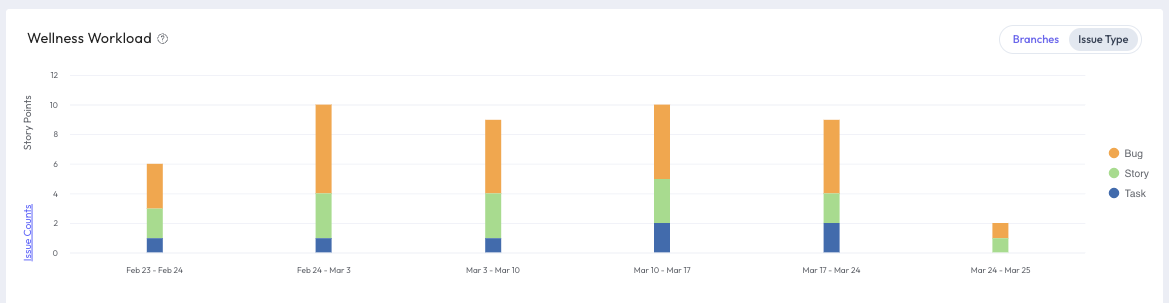
Issue Type Mode
- Groups completed PM issues by issue type (e.g., Bug, Task, Story).
- Provides visibility into work distribution and the developer’s focus areas based on issue types.
By leveraging these insights, team leads can ensure a balanced workload, identify potential bottlenecks, and optimize team efficiency.

Top 5 Completed Items
The Top 5 Completed Items table provides team leads with a quick overview of a developer’s most recent contributions. Located at the bottom right corner of the dashboard, this table dynamically updates based on the selections in the Wellness Workload widget:
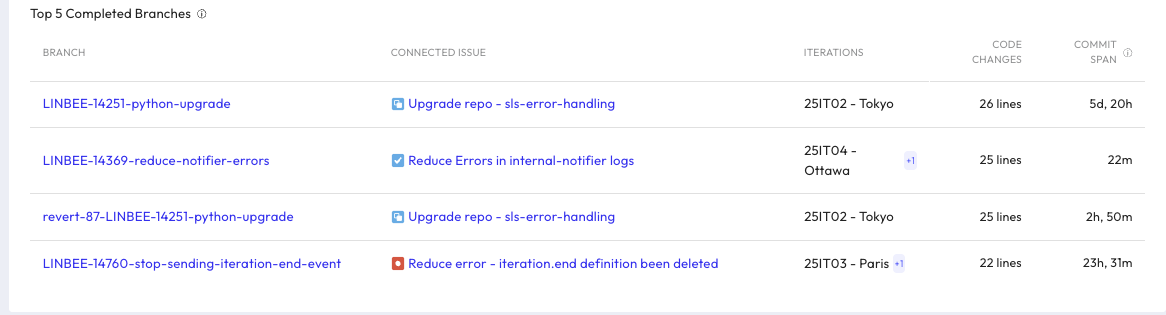
Branches Mode
In Branches Mode, the table lists the most recently completed branches within the selected timeframe.
- Data Collection: Displays the top completed branches.
- Sorting: Ordered by the number of code changes in descending order.
Table Columns:
- Branch Title – Links to the corresponding Git branch.
- Connected Issues – Shows related PM issues. If multiple issues are linked, the first (alphabetically) is displayed, with additional issues available on hover.
- Iterations – Displays the iteration(s) where the branch was worked on. Multiple iterations are indicated.
- Code Changes – Shows the number of lines of code modified.
- Commits Range – Indicates the time span between the first and last commit in the branch.

Issue Type Mode
In Issue Type Mode, the table lists the top completed PM issues within the selected timeframe.
- Data Collection: Displays issues marked as “done” within the timeframe.
- Sorting: Ordered by story points in descending order. If multiple issues have the same story points, they are sorted by time in progress.
Table Columns:
- Issue Title – Links to the detailed view of the completed item.
- Connected Branches – Displays associated branches. If multiple branches are linked, the first (alphabetically) is shown, with additional branches viewable on hover.
- Iterations – Displays the iteration(s) where the issue was worked on. Multiple iterations are indicated.
- Story Points – Shows the number of assigned story points for the issue.
- Time in Progress – Indicates how long the issue remained in the “in progress” status before completion.

Developer Metrics
The Developer Metrics section provides a radar chart that evaluates a developer’s performance as both a PR submitter and a PR reviewer.
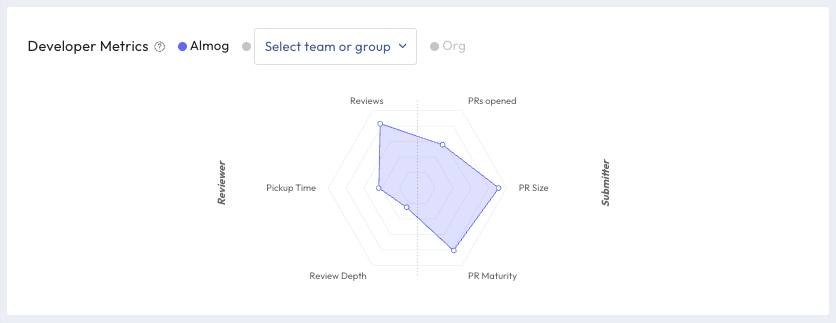
Submitter Metrics
- PRs Opened (hover to view number of PRs and investigate deeper)
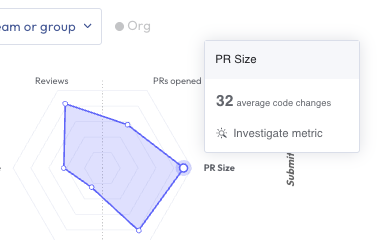
- PR Size (hover to view average code changes and access Investigate Metric link)
- PR Maturity (hover to view percentage of mature PRs)
Reviewer Metrics
- Reviews (hover to view number of reviews)
- Review Depth (hover to view comments per review with an Investigate Metric link)
- Pickup Time (hover to view average time it takes for a PR to be picked up)
Clicking or hovering on any section of the radar chart displays tooltips and detail cards with additional insight. These cards may also include direct links to related deep-dive views.
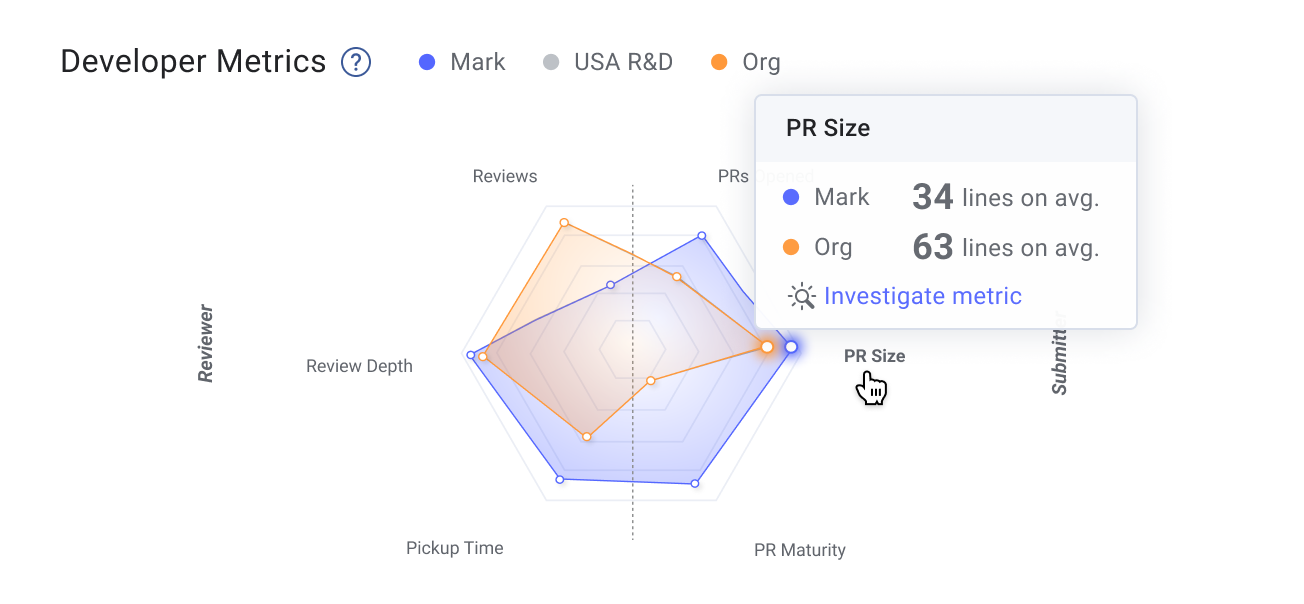
You can also compare a developer against:
- A selected team
- The broader organization

Interpreting Developer Metrics
These metrics help team leads understand an individual developer’s strengths and challenges:
- Are they submitting a high number of small, well-structured PRs? They might be reviewing fewer PRs.
- Are they a senior developer handling a high volume of reviews? They may be opening fewer PRs but providing high-value feedback.
- Are they balanced across submission and review metrics? This indicates they are contributing both as a coder and as a reviewer.
By analyzing these graphs, managers can identify potential stress points, ensure developers are spending time effectively, and make informed decisions, such as:
- Encouraging a senior developer to delegate some reviews to mid-level engineers for mentorship opportunities.
- Helping a developer overwhelmed with large PRs to break them into smaller, more manageable ones.
- Identifying team members who contribute across multiple areas and ensuring they receive proper recognition.

Comparing Developer Workloads
Selecting the second and third radio buttons enables you to compare the developer's workload distribution against another team or all developers across the organization, providing a broader context for performance and workload analysis. This is particularly useful for onboarding teammates, allowing them to track their progress relative to their peers and gain confidence that they are focusing on the right tasks.

By leveraging Top 5 Completed Items and Developer Metrics, team leads can drive data-informed coaching, foster balanced contributions, and ensure developers are working in ways that align with both team objectives and individual growth.

Related HelpDocs
How did we do?
Developer Metrics