Table of Contents
What are Project Delivery Trackers?
Project Delivery Trackers offer a high-level view of an organization's projects as they are managed by the organization's project management tool (Jira). A LinearB project is a flexible entity that c…
Project Delivery Trackers offer a high-level view of an organization's projects as they are managed by the organization's project management tool (Jira). A LinearB project is a flexible entity that can include a board, an epic, a label, fix version, or custom field value, or any combination of the entities mentioned above.
Main Page Overview
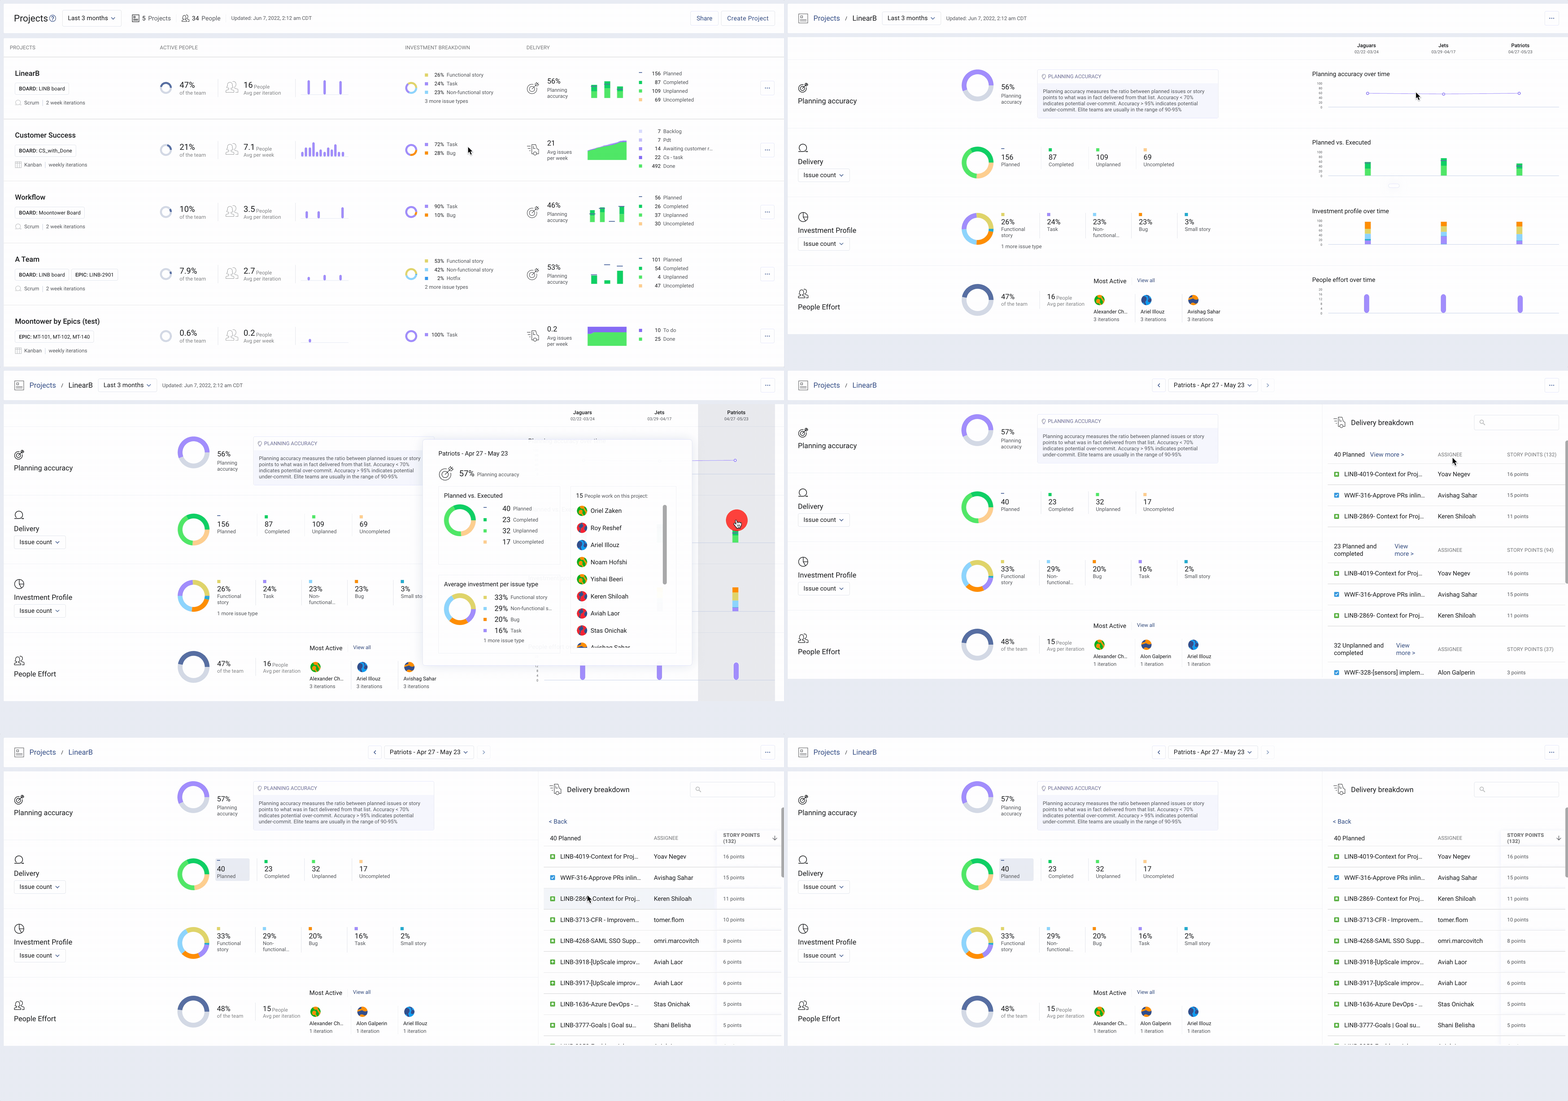
From the main page of your Projects dashboard, you can see the list of projects in your organization as well as get an at-a-glance update into team allocation, investment breakdown, and planning accuracy.
- Click on the "Last 3 months" dropdown to edit the length of time the dashboard displays.
- To dig deeper into an individual project, click on the Project Delivery Tracker itself to open the Expanded View.
General project information
This will include the name of the project, the agile methodology that is used in the project, and the cadence of the project.

Active People
Does the amount of effort align with business strategies? This area shows the number of the people invested in the project over time. There are 3 values relevant for the people effort:
- Percentage of the team members contributing to the project out of all the people currently working on projects.
- Users contributing to the project over the relevant timespan.
- The total number of people contributing to the project in each iteration.

Investment Strategy
Are we delivering the desired value? This displays the types of the completed tasks, broken out by the percentage of total tasks completed.

Delivery
Are we delivering efficiently? Based on the methodology type of the project this area displays relevant information about delivery.
Planning accuracy of the iteration is the ratio of the planned and completed issues or story points out of the total issues or story points planned for the iteration.
- Planned - Story points or issues added before or within 24 hours of a sprint beginning.
- Added - Story points or issues added and completed after the sprint begins.
- Completed - Planned story points or issues completed in a sprint.
- Carryover - Planned but not completed story points or issues.

In the case of Kanban methodology - LinearB displays a cumulative flow diagram showing the changes over time of tickets in each swim lane of the Kanban board.

Project Delivery Tracker: Expanded View
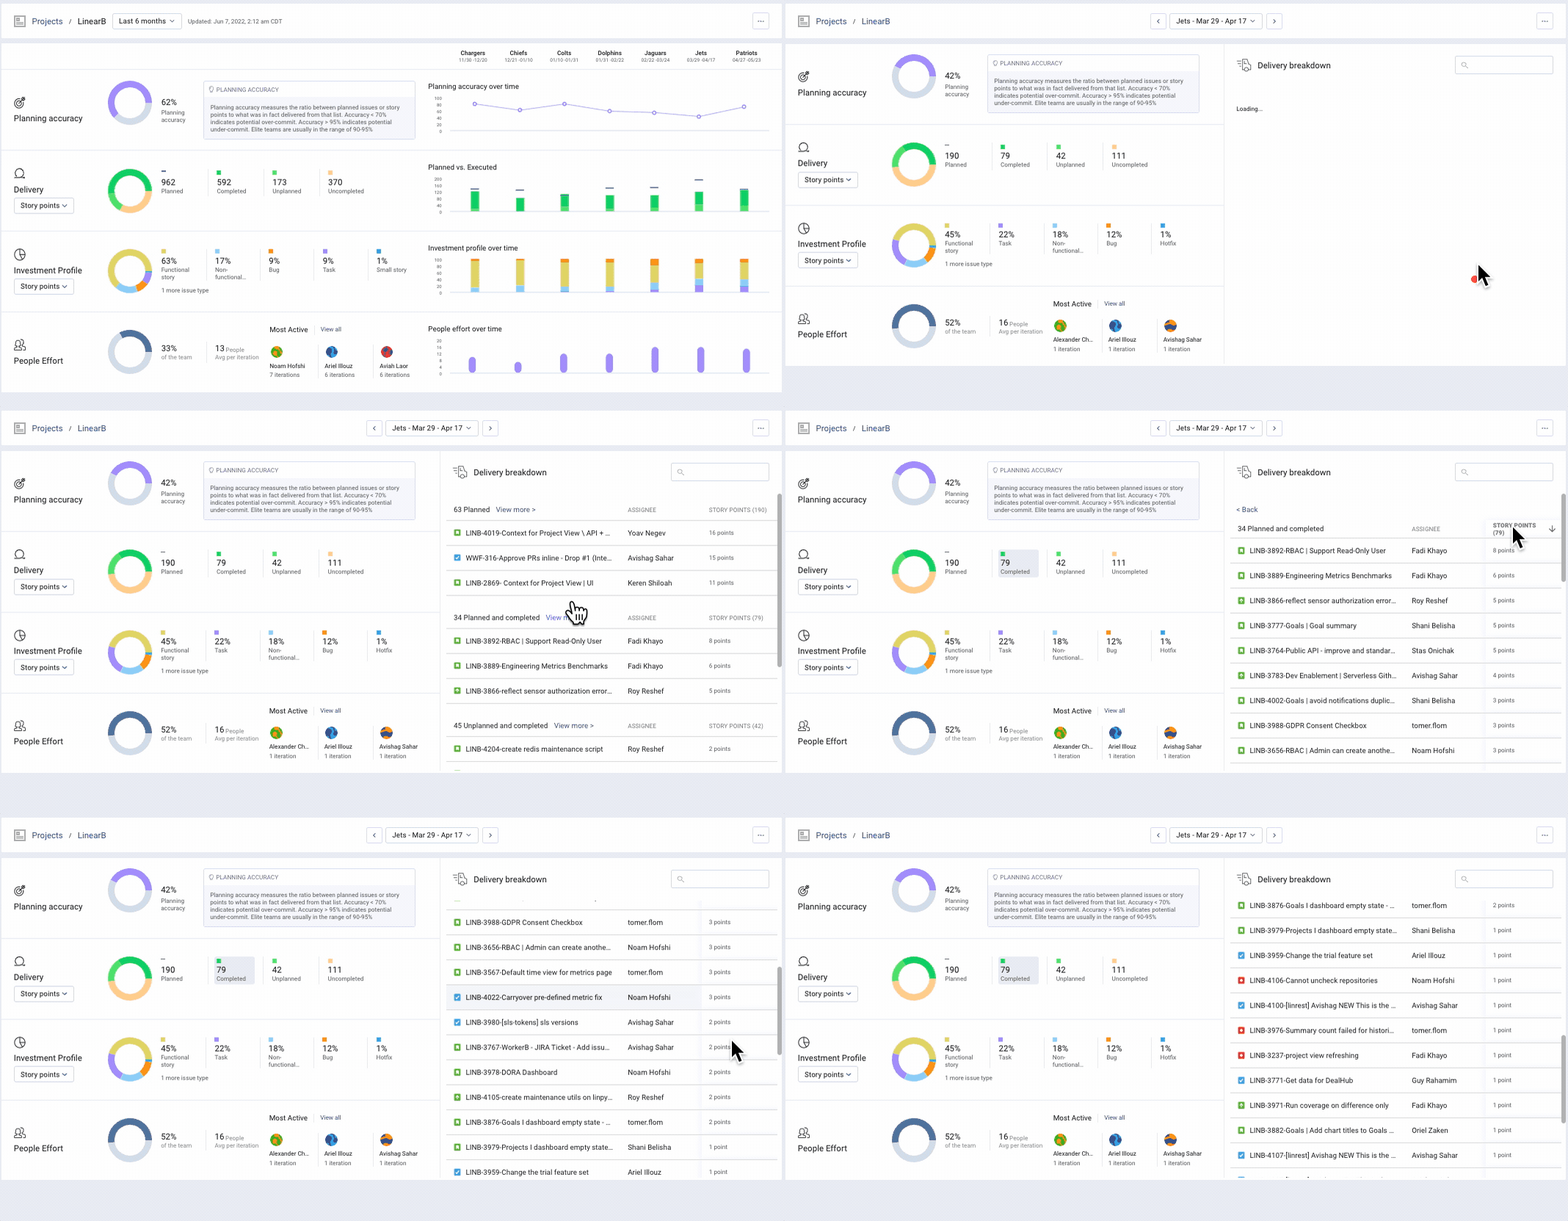
Click on any Project Delivery Tracker from the main page overview to see a detailed breakdown of your metrics. Here you can find details about your project's overall performance.
- Hover over and click into specific iterations or calendar weeks (depending on if you're viewing a Scrum or Kanban board) in order to see specific metrics for these segments.
- Change your Investment Strategy and Delivery sections to display either story point or issue count breakdowns.

Accuracy Scores: Scrum
This shows the average accuracy for the relevant timeframe as well as iteration breakdown of the planning accuracy. The planning accuracy is benchmarked and provides insights for teams regarding different values of this metric.
- Planning Accuracy: Planning accuracy measures the ratio between planned issues/story points and what were actually delivered from that list.
- Committing Goal (Capacity Accuracy): Capacity accuracy measures how many issues or story points your team completed in an iteration (planned and unplanned) vs the amount that was planned.

Velocity: Kanban
For Kanban projects, LinearB shows extended information about the number of issues that were completed on average per week, as well as a weekly breakdown of the number of issues completed in each week.

Delivery: Scrum
This view breaks down your project into the issues/story points that were planned and unplanned. It also breaks down completed, and uncompleted work.
- Planned work - Story points or issues added before or within 24 hours of a sprint beginning.
- Added work - Story points or issues added after a sprint begins.
Click on the "Switch to delivery by planned" link to just view issue/story points of planned iteration work. Use "Switch to deilvery by completion" to see a breakdown of all planned and unplanned work added to your sprint.

Delivery: Kanban
For Kanban projects, this view will show the total issues/story points in each swim lane. Click on any swim lane icon to remove that lane from your reporting graph. It's advisable to remove the "done" category in order to see the progress of active work.

Investment Strategy
A breakdown of the type of work that was completed on this project. This will show the percentage each issue type contributes to all closed issues/story points. To the right is a breakdown of issue type over each week/iteration. Note that you can change between issue count and story point in the expanded view.

People Effort
A list of the most active people in this project, with the option to "View all", which opens the list of all the people who have completed issues or story points in this project, as well as the number of iterations in which each person contributed to the project. And finally the number of people who completed a story point or issue for the project in each iteration.

Single iteration/week delivery breakdown
Click on any sprint or week from your extended view to find additional information about a single iteration or week. Clicking on the iteration/week will open a page that displays iteration-specific information about the planning accuracy, delivery, investment strategy, and people effort.

LinearB will list all issues used in calculating your metrics on the right side of this page. Click View more next to any issue-set to see the full list and points tabulated for each segment of your delivery metrics.
Export as PNG
The Project Delivery Tracker is available in a PNG format for sharing with stakeholders as well as embedding is slide decks or other presentations. The export option is available in the share menu at the top right corner of the Project Delivery Tracker.

Configuration
Any number of project delivery trackers can be built, edited, and deleted as your reporting needs evolve. To learn how to create project delivery trackers, please read here: How to Create and Edit LinearB Project Delivery Trackers
How did we do?
Using Project Filters in LinearB