Table of Contents
Changing your metrics from average to median or percentile
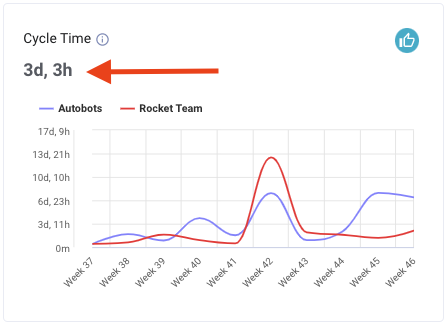
In some places, primarily in your metrics reports, LinearB will calculate your metrics based on either the average, median, or percentile of the data collected. LinearB's research indicates that grap…

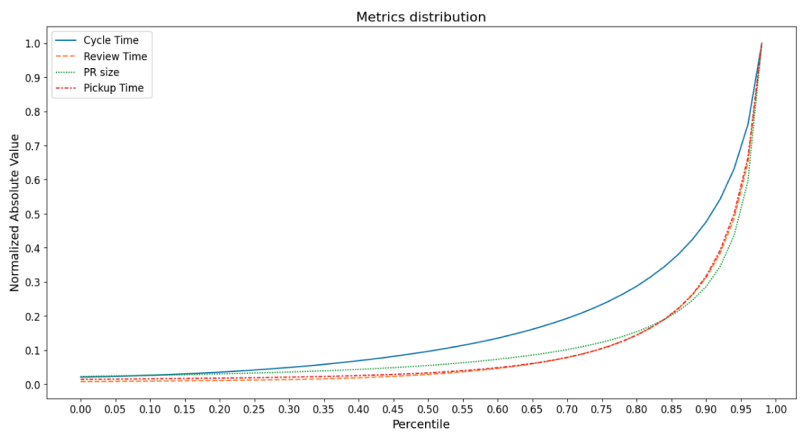
In some places, primarily in your metrics reports, LinearB will calculate your metrics based on either the average, median, or percentile of the data collected. LinearB's research indicates that graphing the distribution of developer cycle-time metrics results in a "hockey-stick" pattern (see the nifty graph below). Measuring your cycle time by average is useful for small organizations, though this number can easily be thrown off by outliers, and will struggle to scale when measuring larger samples of data. Median cycle time could struggle to show meaningful data, as a large percentage of PRs have a very short life cycle. Measuring your organization's cycle time from the 75th percentile is LinearB's recommendation for the most effective method of finding a balanced representation of your organization's general cycle time, while not being impacted by outliers.
How to change your metrics from average to median or percentile
Organization-Wide Setting
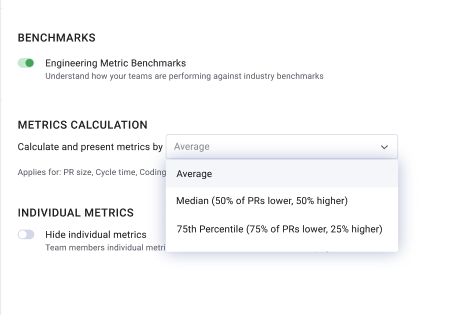
In order to update your settings, go to Company Settings -> General. Click on the dropdown next to Metrics Calculation and select your desired
Per-Widget Setting
Within the Metrics tab, your cycle time and PR size widgets can be set indiviudally to see metrics in either average, 75th percentile, or 50th percentile.
Where do I see average/median/percentile metrics?
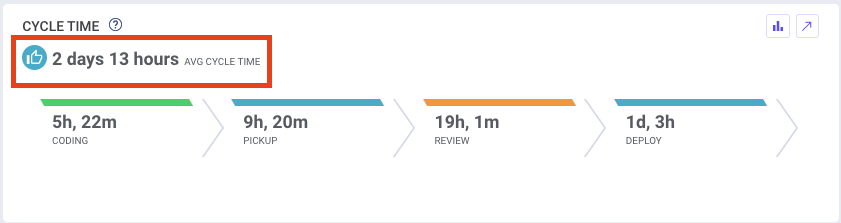
Metrics are averaged in the following widgets within the metrics view and in your cycle time calculation found on dashboards.
Dashboard View
- Cycle Time widget
Metrics Tab Widgets
- Cycle Time
- Coding Time
- Pickup Time
- Review Time
- Deploy time
- PR Size
What does average, median or percentile mean?
Average Calculation:
- (Sum of branch times or PR sizes) / (Number of branch times or PR sizes)
Median Calculation:
- (50% are shorter) → Median ← (50% are longer)
75th Percentile Calculation:
- (75% are shorter) → 75th Percentile ← (25% are longer)
90th Percentile Calculation:
- (90% are shorter) → 90th Percentile ← (10% are longer)
How did we do?
Building a Metrics Dashboard in LinearB
DORA Metrics Dashboard in LinearB