Table of Contents
Releases View
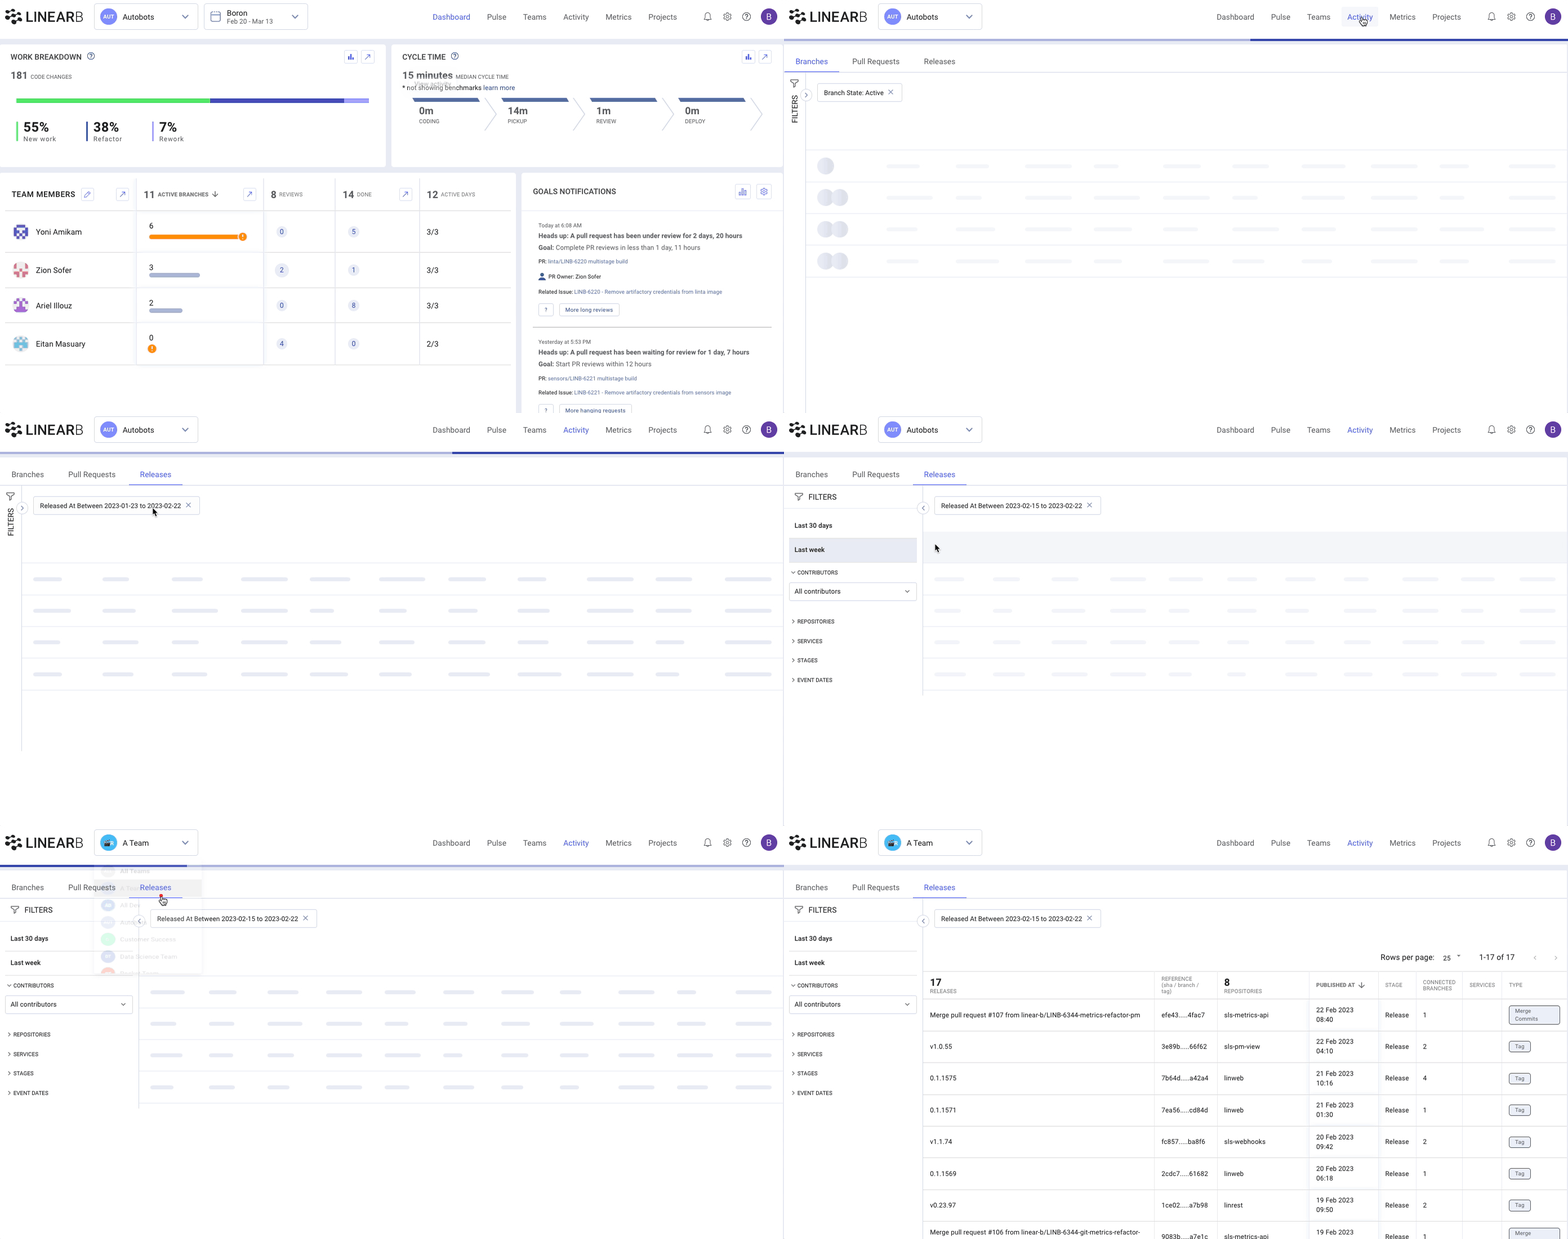
Your Releases report can be found by going to the Activity tab , and selecting Releases. You can also access this page by clicking on a data point in the deploy frequency graph. By default we'll show…
Your Releases report can be found by going to the Activity tab, and selecting Releases. You can also access this page by clicking on a data point in the deploy frequency graph. By default we'll show releases for the past 30 days, you can see releases from farther back using the Event Dates filter.

Filter Options
These reports can be filtered by team (using the team dropdown at the top of your page, or by clicking on the filter menu on the left of this page.
- Contributors
- Branches which a selected developer(s) have contributed code.
- Repositories
- Find deploys to a specific repo. You can also click on the repo name in the releases chart to see all releases to said branch.
- Services
- Filter by services. You can learn how to configure services in LinearB here.
- Stages
- Find branches released into certain stages when released using LinearB's multi-stage release detection.
- Event Dates
- Filter by the date a release occurred.
Data Included
The columns in this report will contain the following data:
Releases
- The release name
Reference
- The git reference (SHA / branch / tag)
- Clicking on the reference will copy it to the clipboard!
Repositories
- The name of the repo which was released
- Clicking on the repo name will filter the table by this repo.
Published At
- The date and time of this release.
Stage
- The name of the deployment stage. This will typically be "Release" unless multi-stage release detection is configured.
- Interested in implementing LinearB's multi-state release detection? Read more here.
- Clicking on the deployment stage will filter the table by this stage
Connected branches
- The number of branches bound to this release
- On hover, a list of the branches' names will be shown. Click on this number to see the specific branches in LinearB.
Services
- The service to which this release relates. You can learn how to configure your services in LinearB here
- Clicking on the service name will filter the table by this service
Release Detection
- The type of release detection that was used to report this release. You can learn more about configuring your release detection in LinearB here.
- API Integration: A release reported by LinearB's deployment API
- Tag: A release detected by a release tag.
- Merge Commits: The PR has been merged to a branch, indicating deployment.
Frequently Asked Questions
Why is the number of deploys found on the releases page higher than the number of releases seen in my deploy frequency report?
LinearB's release page pulls and lists every release it detects. Some of the releases detected are not linked to any branches, some releases are on branches or repos that are excluded from LinearB's reporting. For this reason, occasionally the releases list will be higher than the deploy frequency report.
How did we do?