Iterations Overview
Get a complete view of sprint performance across the Current, Completed, and Trends tabs. Use Iterations to understand delivery accuracy, scope changes, investment distribution, and team effort over time.

The Iterations page in LinearB provides a sprint-by-sprint view of delivery by connecting project management issues (Jira, Shortcut, or Azure Boards) with real Git activity (branches, pull requests, commits, merges, and releases). This helps teams understand execution in the current iteration, review past iterations, and track improvement trends over time.
Summary
- Iterations is a team-level view that connects PM issues with actual Git activity.
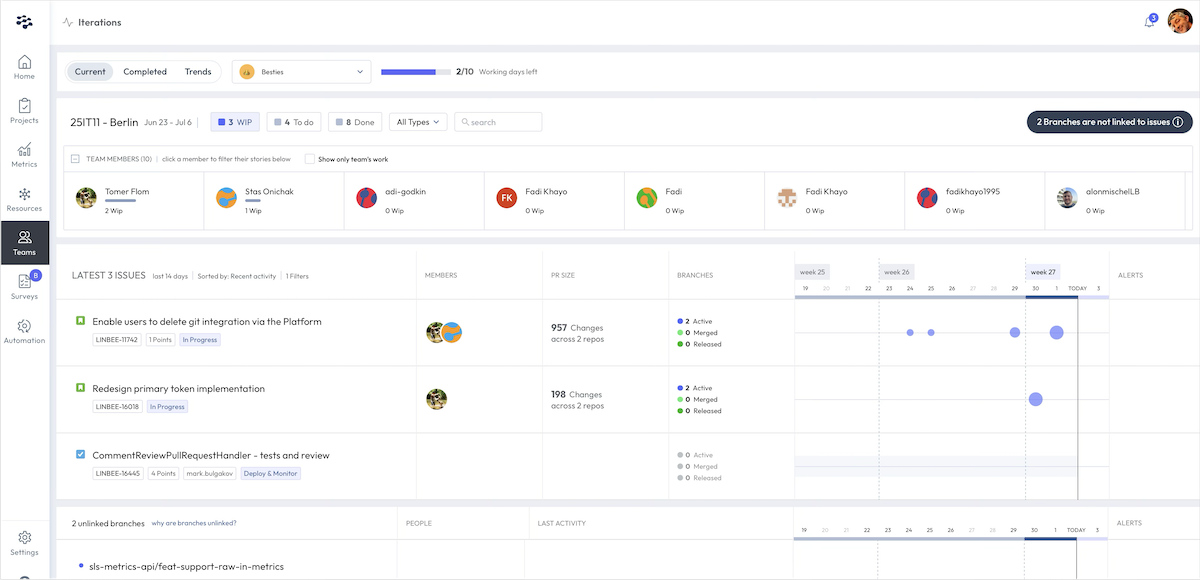
- Use the Current tab to monitor in-progress iteration health and scope changes.
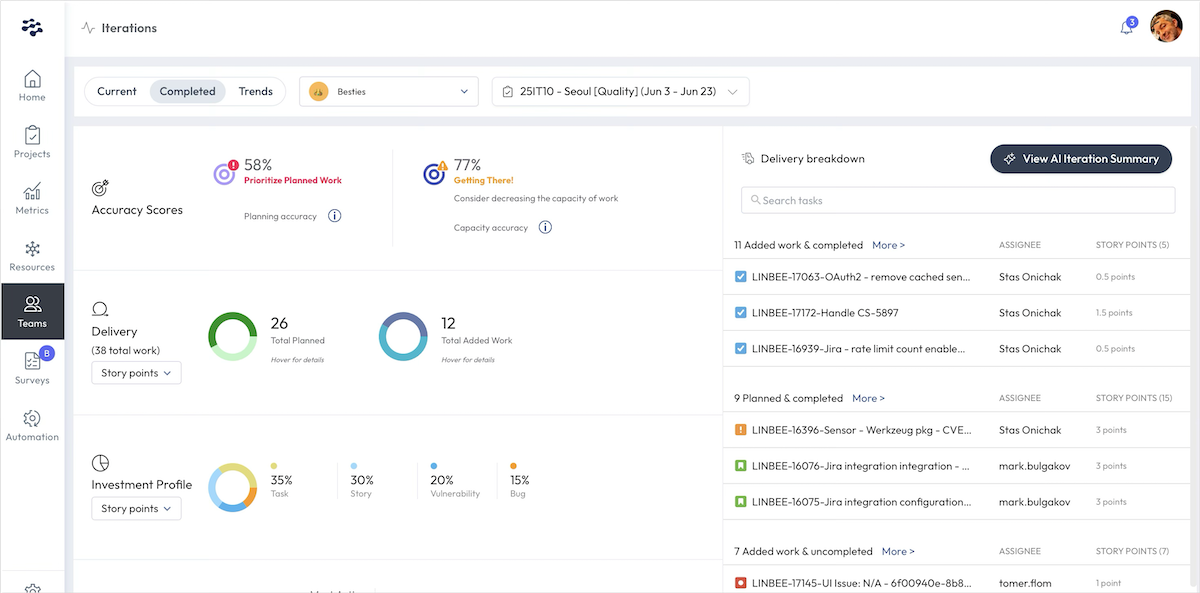
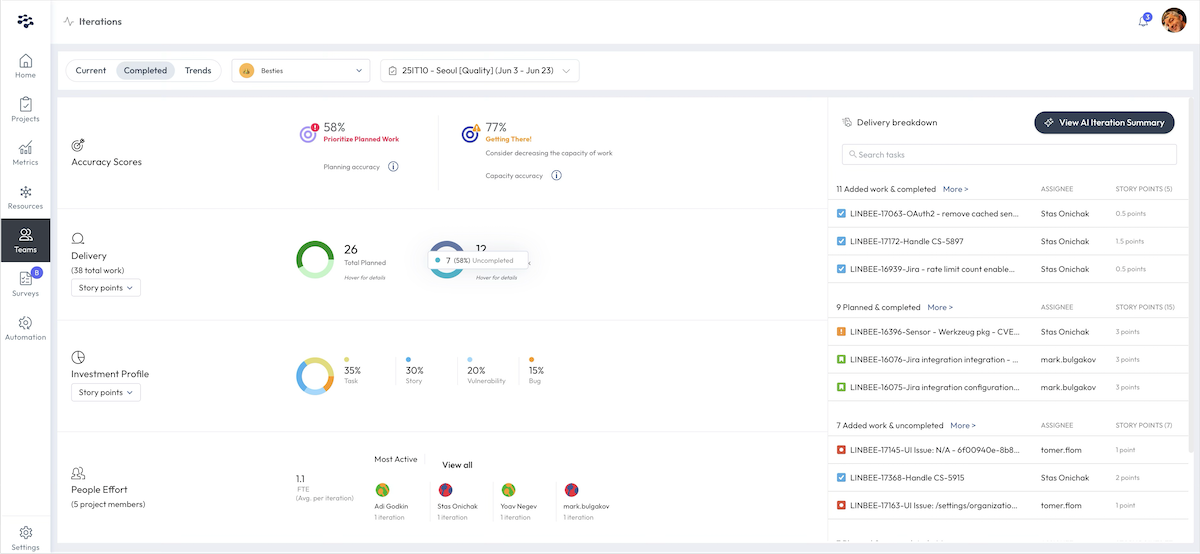
- Use the Completed tab to review outcomes of past iterations.
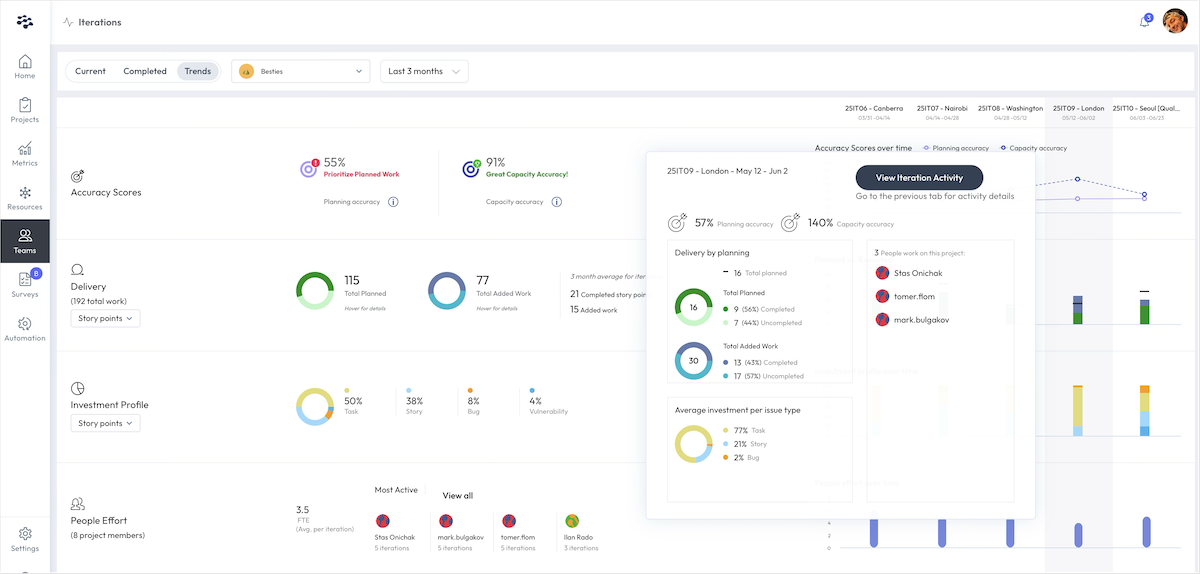
- Use the Trends tab to identify longer-term patterns in delivery and investment.
- Accurate linking depends on using the correct naming conventions for branches and PRs.
What Iterations shows
Iterations combines planning data from your project management tool with engineering activity from Git, so you can see how work moves through a sprint and how closely execution matches the plan.
In Iterations, you typically review:
- Planned vs. completed work for the iteration
- Added scope (work introduced during the iteration)
- Investment profile (distribution across work types such as stories, bugs, tasks, vulnerabilities)
- People effort (participation and contribution signals)
- Git linkage (issues with linked branches/PRs, and unlinked branches that need attention)
Accessing Iterations
- In the LinearB side menu, click Teams.
- Select Iterations.
- Use the team switcher to choose the team you want to analyze.
- Select an iteration from the iteration selector.
Tabs in Iterations
The Iterations page includes three tabs:
- Current – Focuses on the active iteration, showing in-progress work, planned vs. completed progress, and changes introduced during the iteration.
- Completed – Displays past iterations so you can review delivery results, planning outcomes, and participation across sprints.
- Trends – Aggregates data across multiple iterations to help identify patterns, improvement opportunities, and sustained execution behavior over time.
How LinearB links Git work to issues
Iterations links Git activity to issues by detecting the issue identifier in branch names, pull request titles, and (optionally) commit messages. When the identifier is found, Iterations associates the branch/PR activity with the matching issue.
If branches and PRs are not named using the expected pattern, Git activity may appear under Unlinked Branches instead of being associated with an issue.
Using Iterations during the sprint lifecycle
Iterations is useful throughout the sprint lifecycle:
- During execution – Track progress, added scope, and bottlenecks in the Current tab.
- During retrospectives – Review outcomes and delivery breakdowns using the Completed tab.
- Continuous improvement – Use Trends to identify recurring patterns and planning drift.
How did we do?
Iterations: Naming Conventions