Table of Contents
Resource Allocation
Track and optimize developer effort with Resource Allocation in LinearB. Gain insights into FTE distribution, configure reports, and refine resource planning with Jira and Azure PM.
Overview
Resource Allocation ensures that development efforts align with business priorities. The report breaks down developer effort across issues, projects, epics, and initiatives, offering insights into how resources are distributed.
Currently, Resource Allocation is supported with Jira and Azure PM platforms, and the data covers the past six months.
Understanding FTE (Full-Time Equivalent)
Full-Time Equivalent (FTE) is a standard unit for measuring workforce effort. It represents the workload of a full-time employee over a given period of time. For example:
- If two employees each work 50% on a project for a month, their combined effort equals one FTE.
- If a developer splits their time across multiple issues, their FTE is distributed accordingly.
- FTE provides a normalized measure of work, allowing teams to evaluate resource distribution effectively.
FTE is calculated by summing the number of workdays allocated to a project and dividing by the total number of available workdays in the period.
Allocation of Work by Subtasks
When subtasks are assigned to different team members, their effort rolls up into the parent issue:
- The parent issue reflects work allocation for all assignees.
- If person A is assigned to the parent issue and subtasks are split between A, B, and C, then B and C’s efforts are included in the parent’s total FTE.
Visualizing Work Allocation with FTE
The table below illustrates how FTE is allocated when a developer works on multiple tickets throughout the week. In this example, "Fred" is assigned different tickets across various days, and his FTE is distributed accordingly.
This example demonstrates that FTE is divided among active tickets based on the time spent on each issue.
Fred's Week | Monday | Tuesday | Wednesday | Thursday | Friday |
Git activity | PR linked to Ticket A | ||||
Tickets in progress |
|
|
|
| |
Days allocated to Ticket A | 1 | 0.5 | 0.33 | 0 | 0 |
Days allocated to Ticket B | 0 | 0.5 | 0.33 | 0 | 0 |
Days allocated to Ticket C | 0 | 0 | 0.33 | 1 | 1 |
Issue Ownership and Co-Ownership
Resource Allocation assigns effort based on the primary assignee of an issue. Co-owners or secondary owners are not considered when calculating work effort. If an issue’s assignee changes, the new assignee's allocation updates accordingly.
Activity Tracking in GitHub and Jira
- Jira provides detailed insights into FTE and activity per team.
- GitHub primarily tracks ticket activity but does not directly contribute to FTE calculations.
- Both tools provide activity signals that indicate work progress.
Active Issue Determination:
- Jira Ticket Modifications: An issue remains active for seven days after any modification.
- Git Activity on a Ticket: A ticket is considered active only on the day of the Git activity.

Navigating the Resource Allocation Report
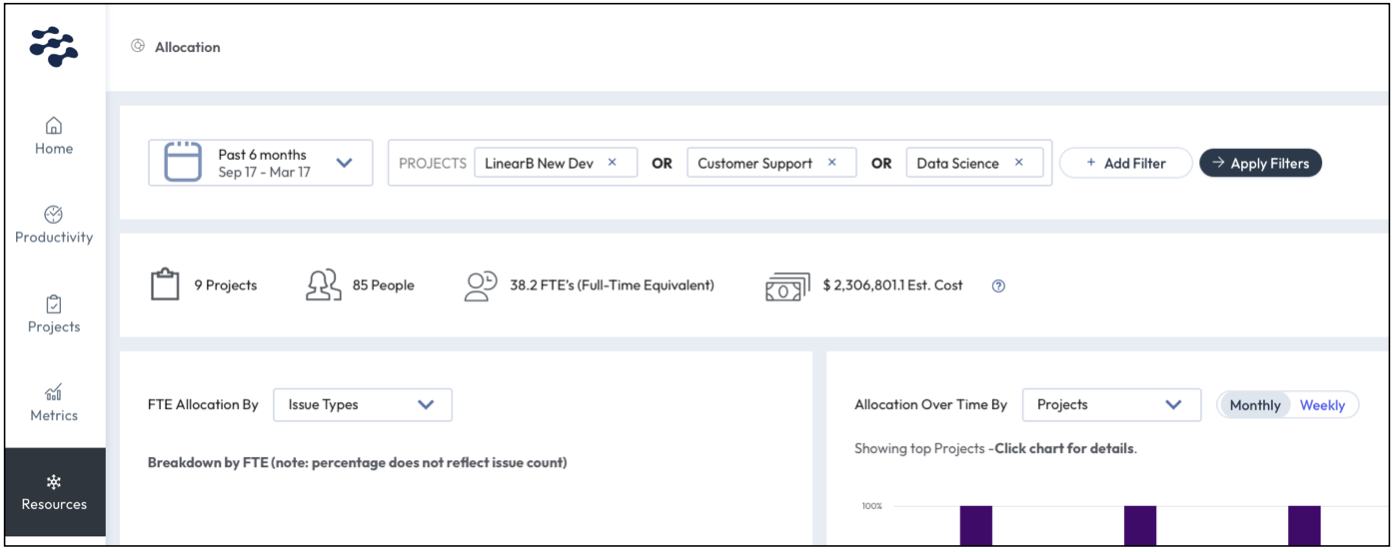
Access the Resource Allocation report by selecting the Resources in the LinearB side menu. The top section of the report displays:
- A date picker to adjust the reporting period.
- The number of projects included in the report.
- The number of unique contributors working within the selected timeframe.
- The FTE value, representing total effort across all projects.
Allocation Trends Over Time
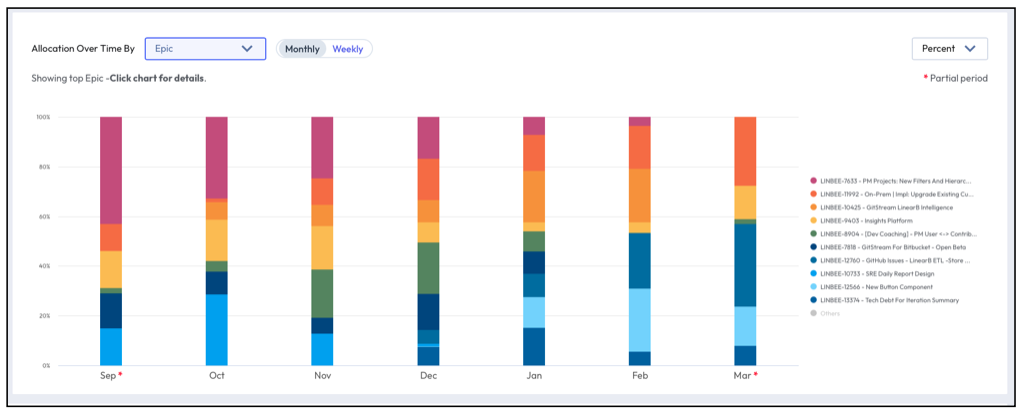
The Allocation Over Time By graph visualizes organizational effort across different segments, including:
- Issue types
- Projects
- Labels or custom fields (Jira)
- Initiatives
- Epics
- Work items, features, and tags (Azure Boards)
Selecting a segment provides a detailed breakdown of:
- Top contributors to the selected category.
- Percentage of total FTE allocated.
- Estimated cost of allocated resources.
You can refine the displayed data by clicking the labels to the right of the graph. This allows you to focus on specific projects, initiatives, or issue types for a more detailed analysis.
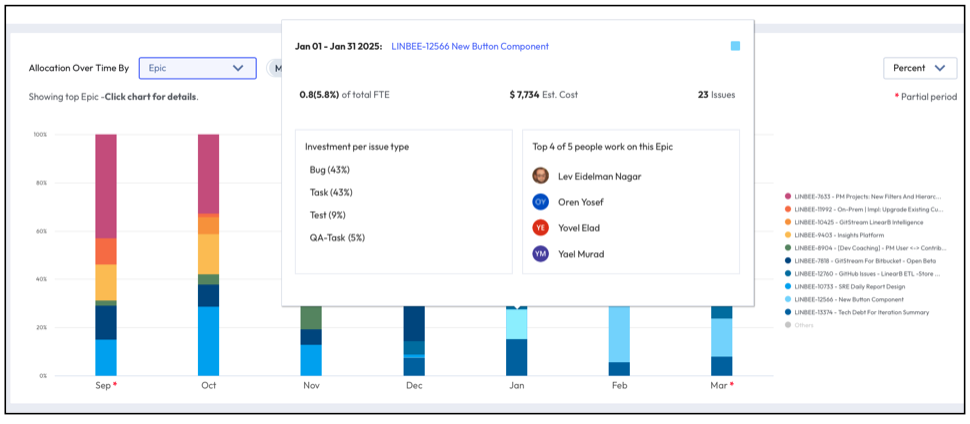
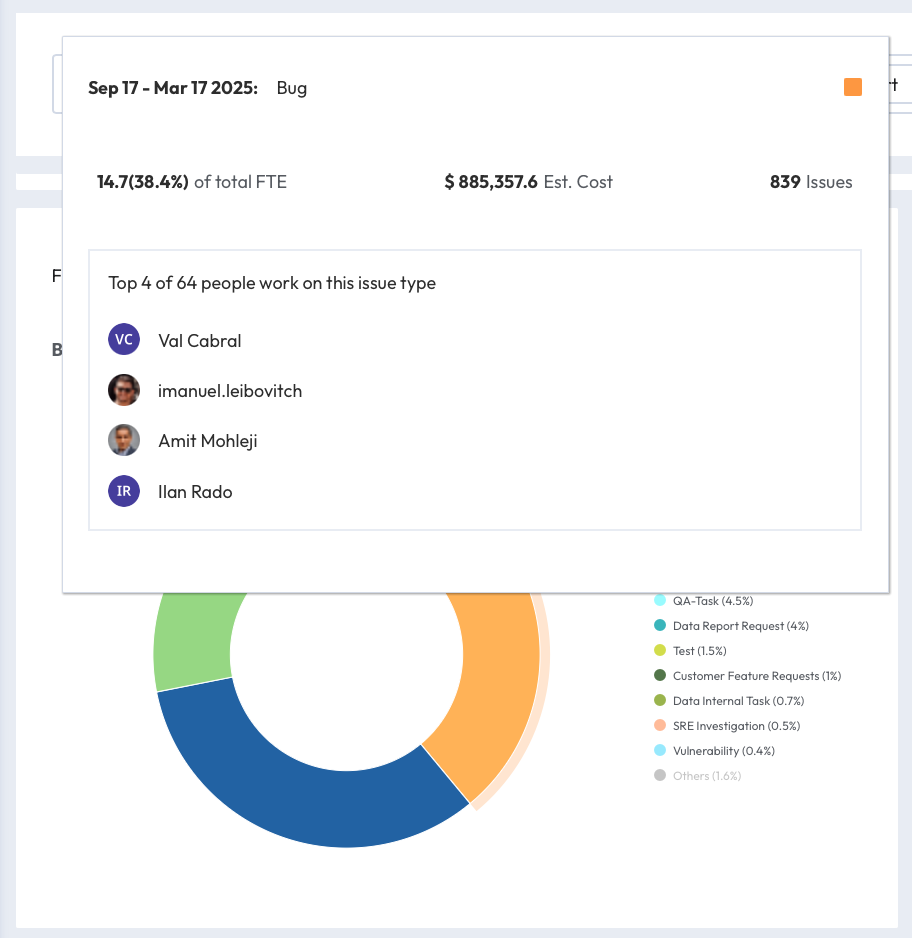
Clicking on any segment within the graph will display a detailed breakdown of effort invested in that category for the selected time period. The breakdown includes:
- A list of issue types within the segment.
- Top contributors who worked on the issues.
- The FTE count as a number and percentage of total FTE.
- A cost estimate of the resources allocated to this segment.

Work Unit Breakdown
The Work Unit Breakdown section provides a detailed view of the work LinearB is tracking. Located in the lower half of the Resource Allocation report, this section allows filtering by date range, initiatives, projects, epics, or issues.

Metrics in Work Unit Breakdown
- Epics/Issues – Displays the number of active epics/issues during the selected period. Filtering by initiatives or projects shows epic counts, while filtering by epics reveals issue counts.
- % of Total Work – The percentage of total FTEs allocated within the specified timeframe.
- Effort (FTE) – The total sum of FTEs for all active issues and epics during the period.
- Estimated Cost by FTE – Applies the average employee salary to the FTE metric, providing an estimated cost of allocated resources.
- Issues With No Epics – When filtering by projects, this metric identifies issues that are not linked to any epics, highlighting unaccounted work.
- FTE Allocation by Issue Type – A visual breakdown of resource distribution by issue type. Adjust the date range using the picker at the top of the report to analyze resource investment in different categories.
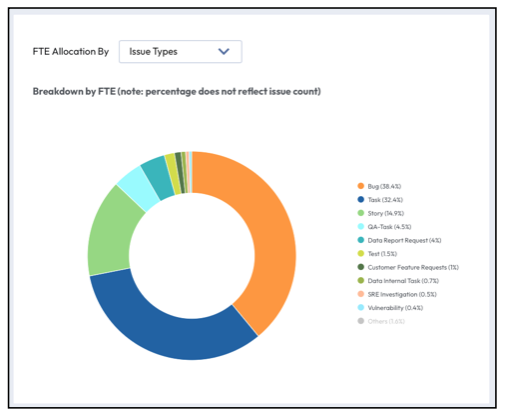
This section helps teams identify whether resources are being effectively allocated to development tasks or diverted by bugs, maintenance, or other work.
Click on any segment of the FTE Allocation by Issue Type graph to view a detailed percentage breakdown of resource dedication to each issue type.

Configuration Options
The Resource Allocation Dashboard automatically gathers data from all synced boards and projects in both Jira and Azure Boards. Users can:
- Modify the list of scanned projects via Settings > Company Settings > Project Management > Project.
Configure the Report
In order to customize the ways in which data can be shown on your report, click the Configure button on the top right of the page. From there, you can select which options exist for data breakdowns in the main Resource Allocation charts:
- Projects
- Issue Types (Jira only)
- Work Item Types (Azure Boards only)
- Initiatives (Jira only)
- Epics
- Features (Azure Boards only)
- Fields (Azure Boards) or Custom Fields (Jira)
- Tags (Azure Boards) or Labels (Jira)
If an option is not relevant to your work breakdown (e.g., your team does not use Epics), you can uncheck it to remove it from the breakdown options.
Filter the Report
By default, the Resource Allocation Report displays all work across the organization for the selected time frame. To narrow the view to specific teams, projects, or issue types, use the filter options located next to the date selector.
Applying Filters
- Click Add Filter to apply new filtering criteria.
- Choose from predefined options such as Projects, Initiatives, Epics, Labels (Jira), Tags (Azure Boards), or Work Item Types.
- Utilize LinearB Team Scope to restrict data to team-specific boards.
- Apply Project Management Filters available in Jira and Azure Boards.
- Use LinearB Project Scope to focus on predefined PDT projects.
- Combine multiple filters for a more granular view of work distribution.
- Adjust and remove filters as needed to customize the report.

FTE Cost Estimation
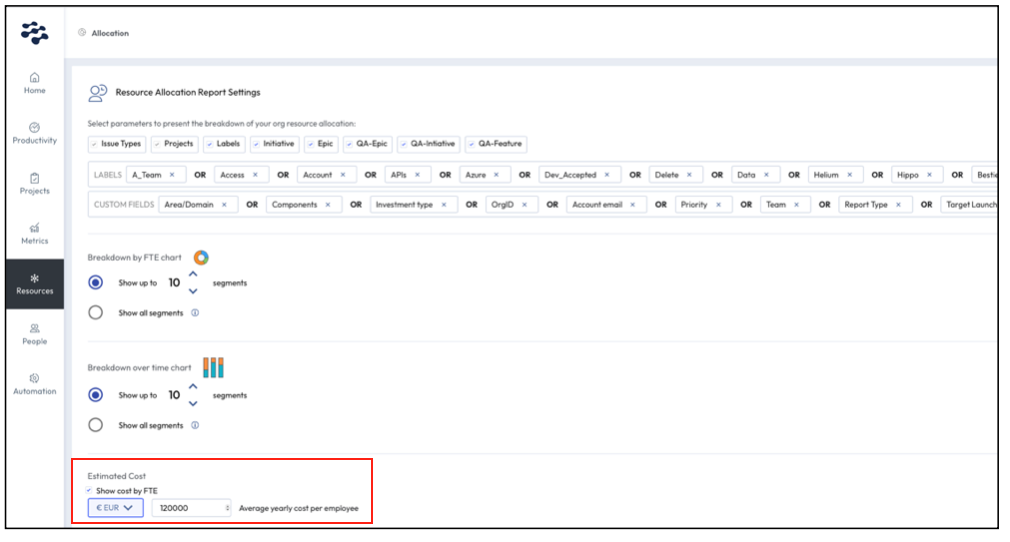
To calculate resource costs, LinearB applies an estimated salary-per-employee value to the FTE metric. To adjust this value:
- Click the Configure button.

- Update the estimated FTE cost per employee.

Best Practices for Resource Allocation
To ensure accurate and meaningful resource allocation data, teams should follow best practices in issue management and workflow automation. Consistent usage of issue assignments and status tracking improves reporting accuracy and resource visibility.
Key Best Practices
- Enforce Clear Assignment Rules
- Assign issues to the developer actively working on them.
- Avoid unassigned issues, as they do not contribute to resource tracking.
- Use Statuses to Track Progress
- Ensure that all active issues are set to “In Progress” or equivalent status.
- Custom statuses are supported, but they must be mapped to the “In Progress” category for tracking.
- Implement Automation for Consistency
- Configure rules to automatically update issue statuses based on activity.
- Use Jira or Azure workflows to prevent issues from remaining in incorrect states.
- Apply automation to reassign stale tickets that have been inactive for an extended period.
By following these practices, teams can enhance the accuracy of resource allocation data, ensuring that developer effort is correctly reflected in reports.
Frequently Asked Questions
How Is an Issue Marked as Active?
An issue is considered active when:
- It has an “In Progress” status with recent activity (ticket updates or Git activity).
- It has Git activity or issue changes recorded on a relevant date.
Why Are There More Contributors Than FTEs?
FTE measures total effort, not headcount. More contributors than FTEs occur because:
- Team members take vacations or sick days.
- Some developers work part-time.
- Developers split time across multiple initiatives.
How Often Does the Report Update?
The Resource Allocation Dashboard updates daily at 6:30 AM UTC. Configuration changes trigger immediate recalculations.

Summary
Resource Allocation in LinearB provides a structured overview of team effort, FTE distribution, and cost estimation. By integrating Jira, Azure Boards, and GitHub, teams can track work efficiently while ensuring business priorities align with development efforts. Using best practices and proper issue assignment improves reporting accuracy and decision-making.
For further assistance, visit the LinearB Help Center.
How did we do?
Investment Strategy