Teams Tab - Features and Definitions
Get a side-by-side breakdown of performance across teams and contributors with the Teams tab—complete with filters, definitions, and meaningful insights into coding activity and collaboration.

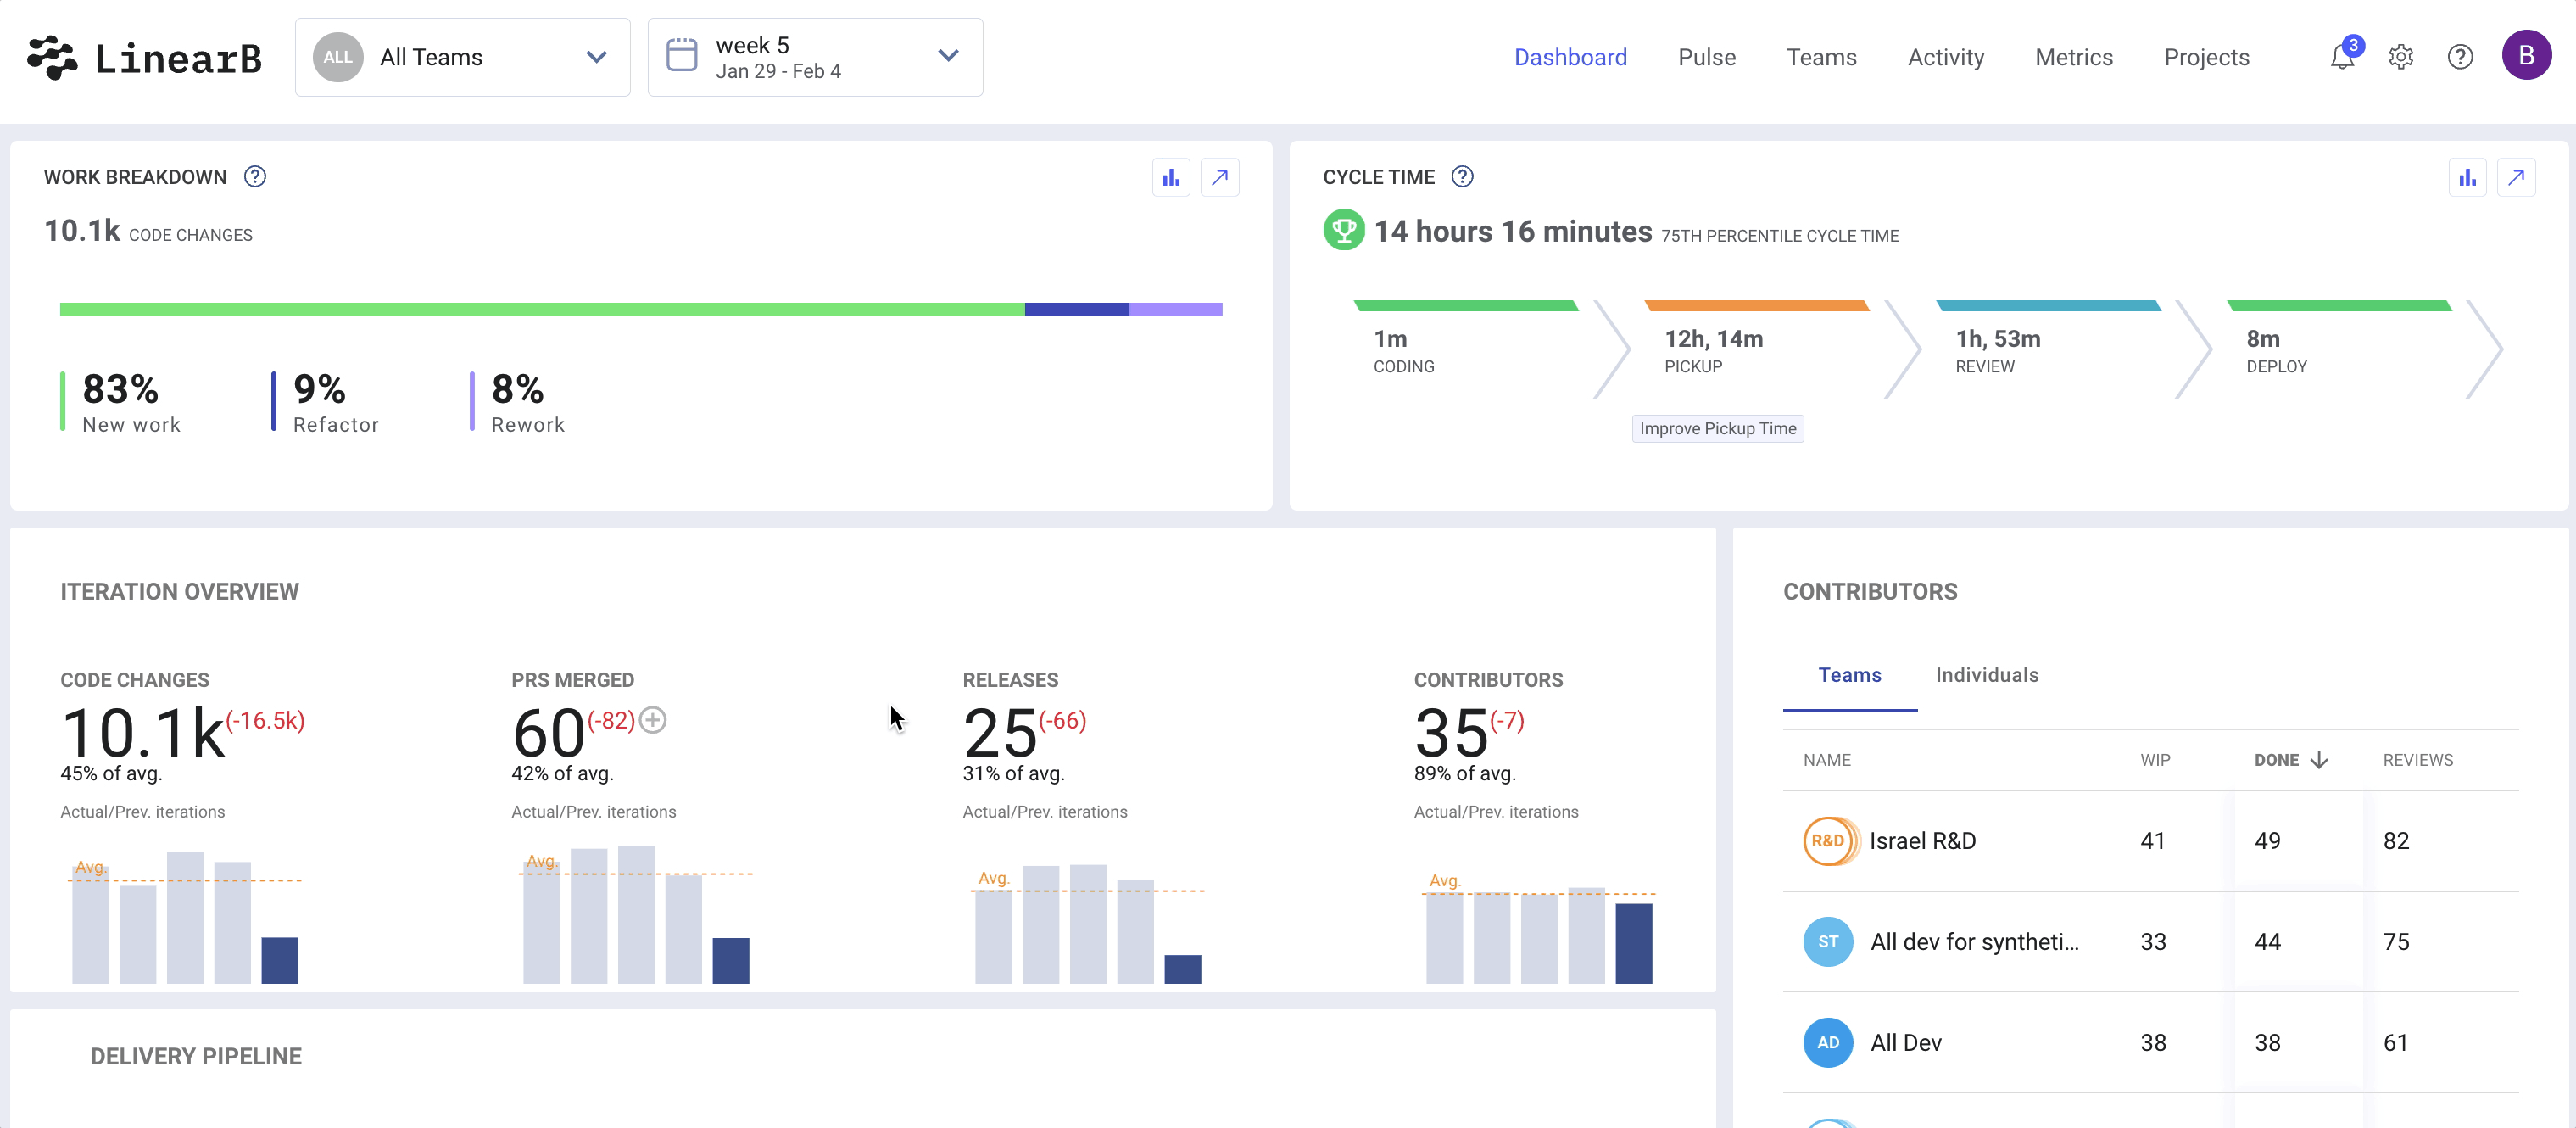
The Teams tab provides a consolidated view of key metrics across all your teams, and—if individual metrics are enabled—across individual contributors as well. This page helps you compare performance at both the team and contributor level over any selected time range.

Metric Definitions
WIP (Work in Progress)
Active Git branches that have not yet been merged or deployed during the selected time frame.
Done
Branches that have reached a "merged" or "deployed" state during the selected time period.
Active Days
The number of days within the selected time range that a team member has demonstrated activity. Activity can include commits, comments, or code reviews.
Code Changes
A comprehensive count of code changes made on a feature branch compared to its base branch. This value reflects the net changes rather than counting repeated edits to the same line of code multiple times.
Repositories
The number of repositories the team or contributor has worked on during the selected time period.
Cycle Time
The average cycle time for all branches worked on in the selected time frame. This includes both in-progress and completed branches. Since cycle time includes active branches, this metric may update as more branches are merged or deployed.
Work Breakdown
Breaks down the lines of code changed into three categories:
- New Work – New lines of code added to the base branch.
- Rework – Changes made to code last edited within the past 25 days.
- Refactor – Changes made to code last edited more than 25 days ago.
PRs Opened
Total number of pull requests opened by the team or selected contributor(s).
Reviews
The total number of pull request reviews submitted. Reviews may be submitted on any PR, regardless of team assignment.
Review Depth
The average number of comments per pull request review, offering insight into review quality and thoroughness. This is calculated by dividing the total number of review comments in the selected time frame by the total number of reviews submitted.

Filtering Options
Date Range
By default, the date range is set to your most recent iteration. You can modify this to view metrics for any time span supported by LinearB.
Team Filter
Select one or more teams to compare their metrics side by side.
Contributor Filter
Filter by one or more contributors to see their individual metrics alongside each other.
How did we do?
Teams Overview