gitStream AI Dashboard
The gitStream AI Dashboard shows AI-driven code review metrics, including reviewed PRs, accepted suggestions, and detected issues. Click charts for details or export the data for reporting.

Updated
by Steven Silverstone
The gitStream AI dashboard in LinearB's Metrics view gives you insights into code quality, reviewer contributions, and AI-assisted enhancements across your repositories. This dashboard tracks suggestions and detected issues to help teams adopt AI responsibly while improving performance and maintainability.

Accessing the gitStream AI Dashboard
- From the LinearB sidebar, click Metrics > Metrics Dashboard.
- Select gitStream AI.
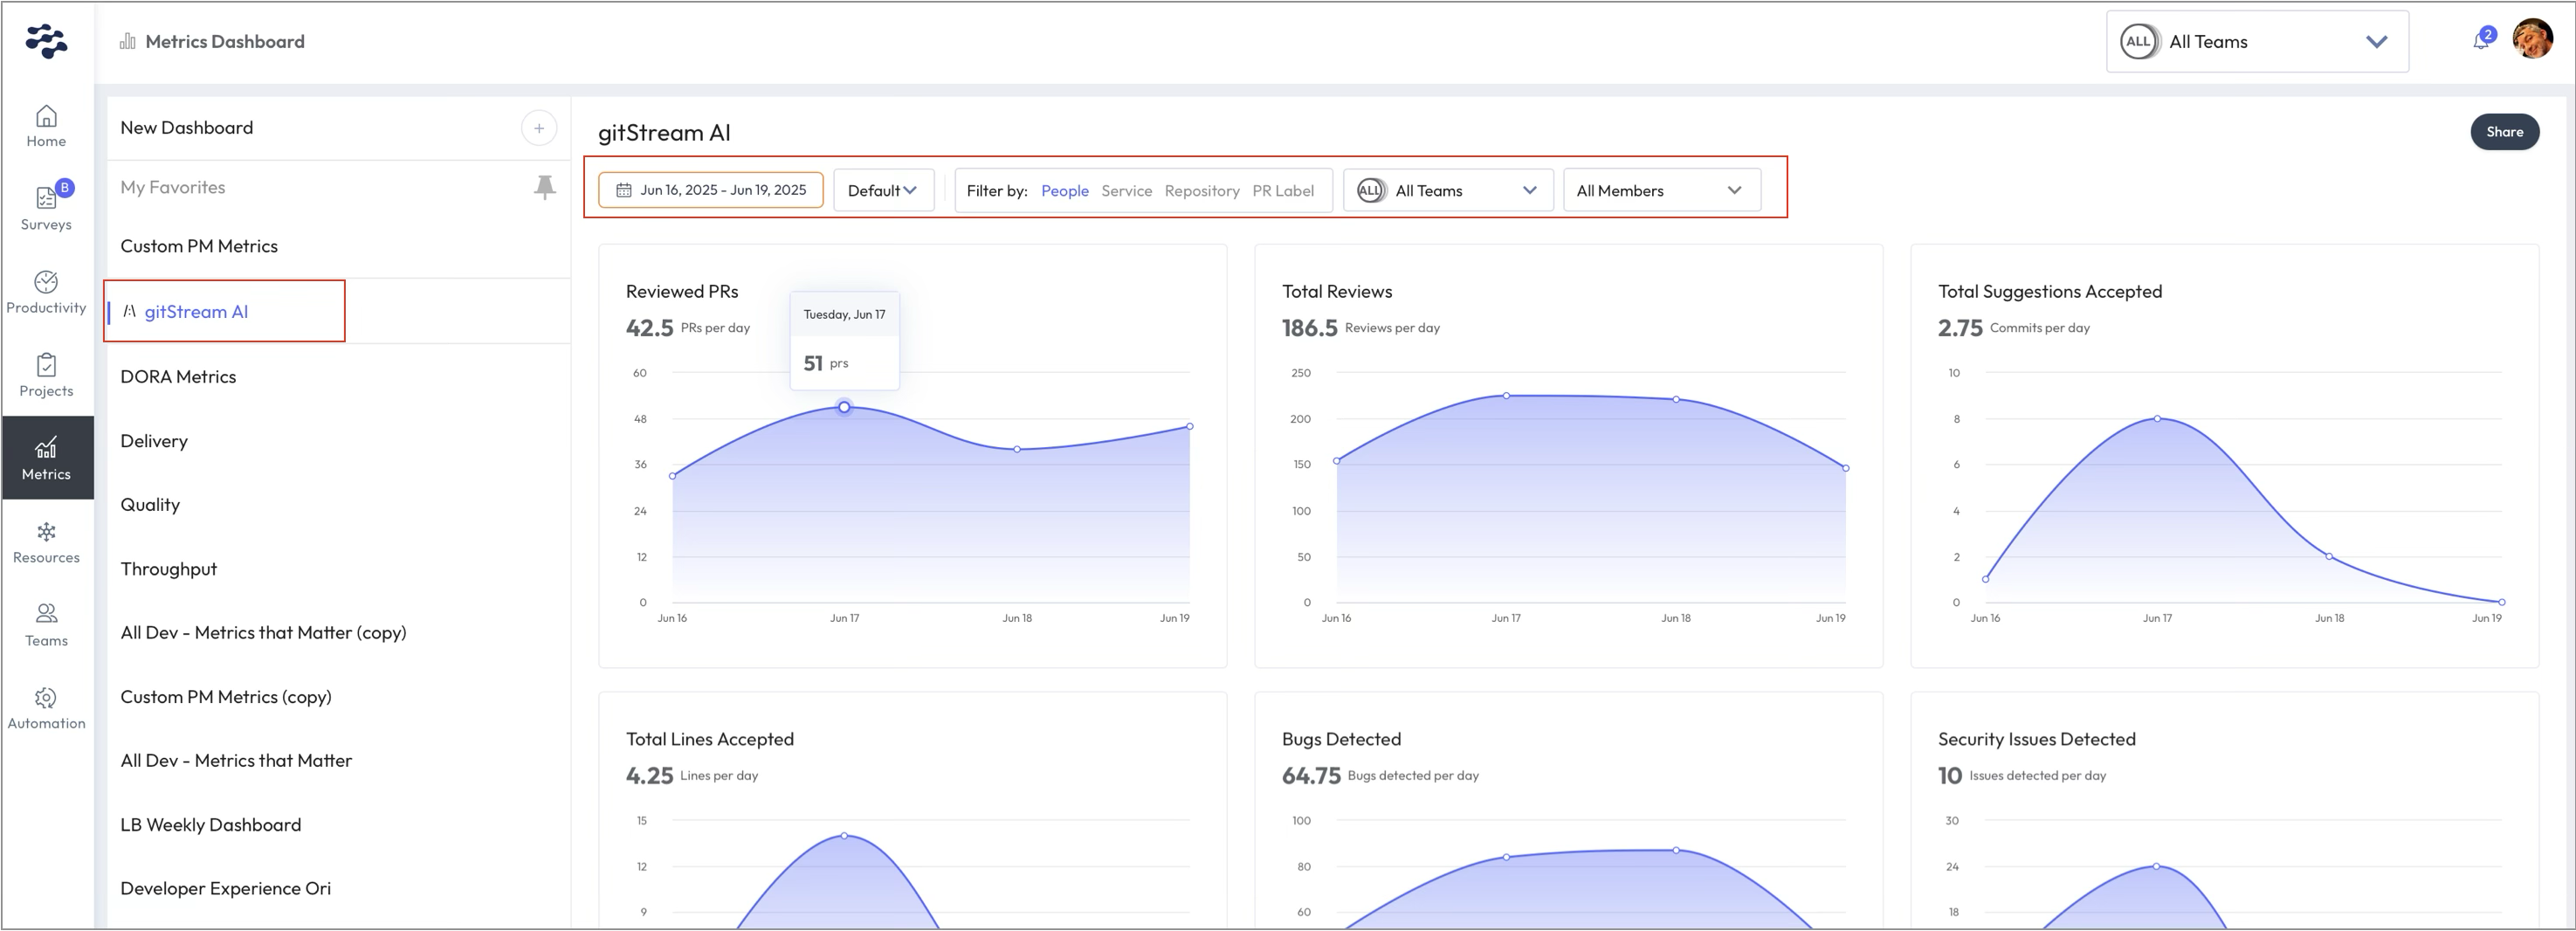
- Use the filters at the top (People, Service, Repository, PR Label, and Team) to narrow down your view.

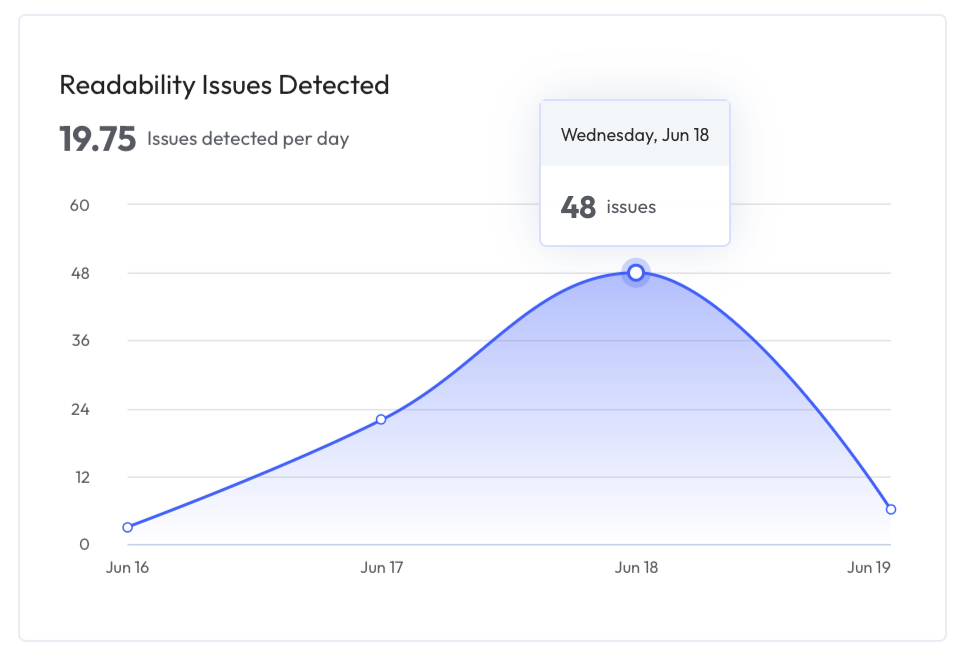
Dashboard Cards
Each card shows a daily average and trend graph for the following:
- AI review usage
- AI review findings

Interacting with Charts
- Hover over any point to view the exact metric for that day.

Exporting and Sharing
Click the Share button to:
- Copy dashboard link (to send via email or chat)
- Export as CSV (for analysis outside LinearB)
- Export as PNG (for presentation or reporting)

Related Articles
gitStream AI: Review Findings
gitStream AI: Review Usage Metrics
How did we do?
Viewing All Teams and All Contributors