AI Review Metrics Overview
Learn how AI Review works, how to configure it, and how to interpret trends and findings across AI-reviewed pull requests.

LinearB’s AI Review surfaces potential risks across pull requests, including bugs, security vulnerabilities, performance concerns, readability issues, maintainability issues, and scope-related gaps.
Unlike traditional rule-based tools that only catch clear-cut problems, AI Review takes a broader and more cautious approach to help teams identify issues earlier in the review process.
This means:
- You may see more findings than expected, including some that turn out to be false positives.
- The AI is intentionally over-inclusive to help ensure nothing critical is missed.
- The goal is to provide review insight, not to block or approve pull requests.
This approach helps teams stay ahead of issues and make more informed review decisions over time.

Configuring AI Review
Issues Limit
The Issues Limit setting controls how many issues are included in the generated AI Review comment on a pull request. Select a number to limit issues, or choose Unlimited to include all identified issues.
Example
If AI Review identifies 12 issues and the limit is set to 3, only 3 issues appear in the pull request comment.
Custom Review Guidelines
You can customize how AI Review comments on pull requests by adding guidelines. These guidelines influence what the AI comments on and what it ignores, helping you focus reviews on what matters most to your team.
Example guidelines
- Do not comment on formatting issues
- Focus only on security and performance concerns
- Ignore changes in test files
Recommended workflow
To achieve the review behavior you want, use this iterative approach:
- Start with the Playground.
- Add specific guidelines, for example, Do not comment on formatting issues.
- Run the review in the Playground using a reference pull request from your repository.
- Iterate until the output matches your expectations.
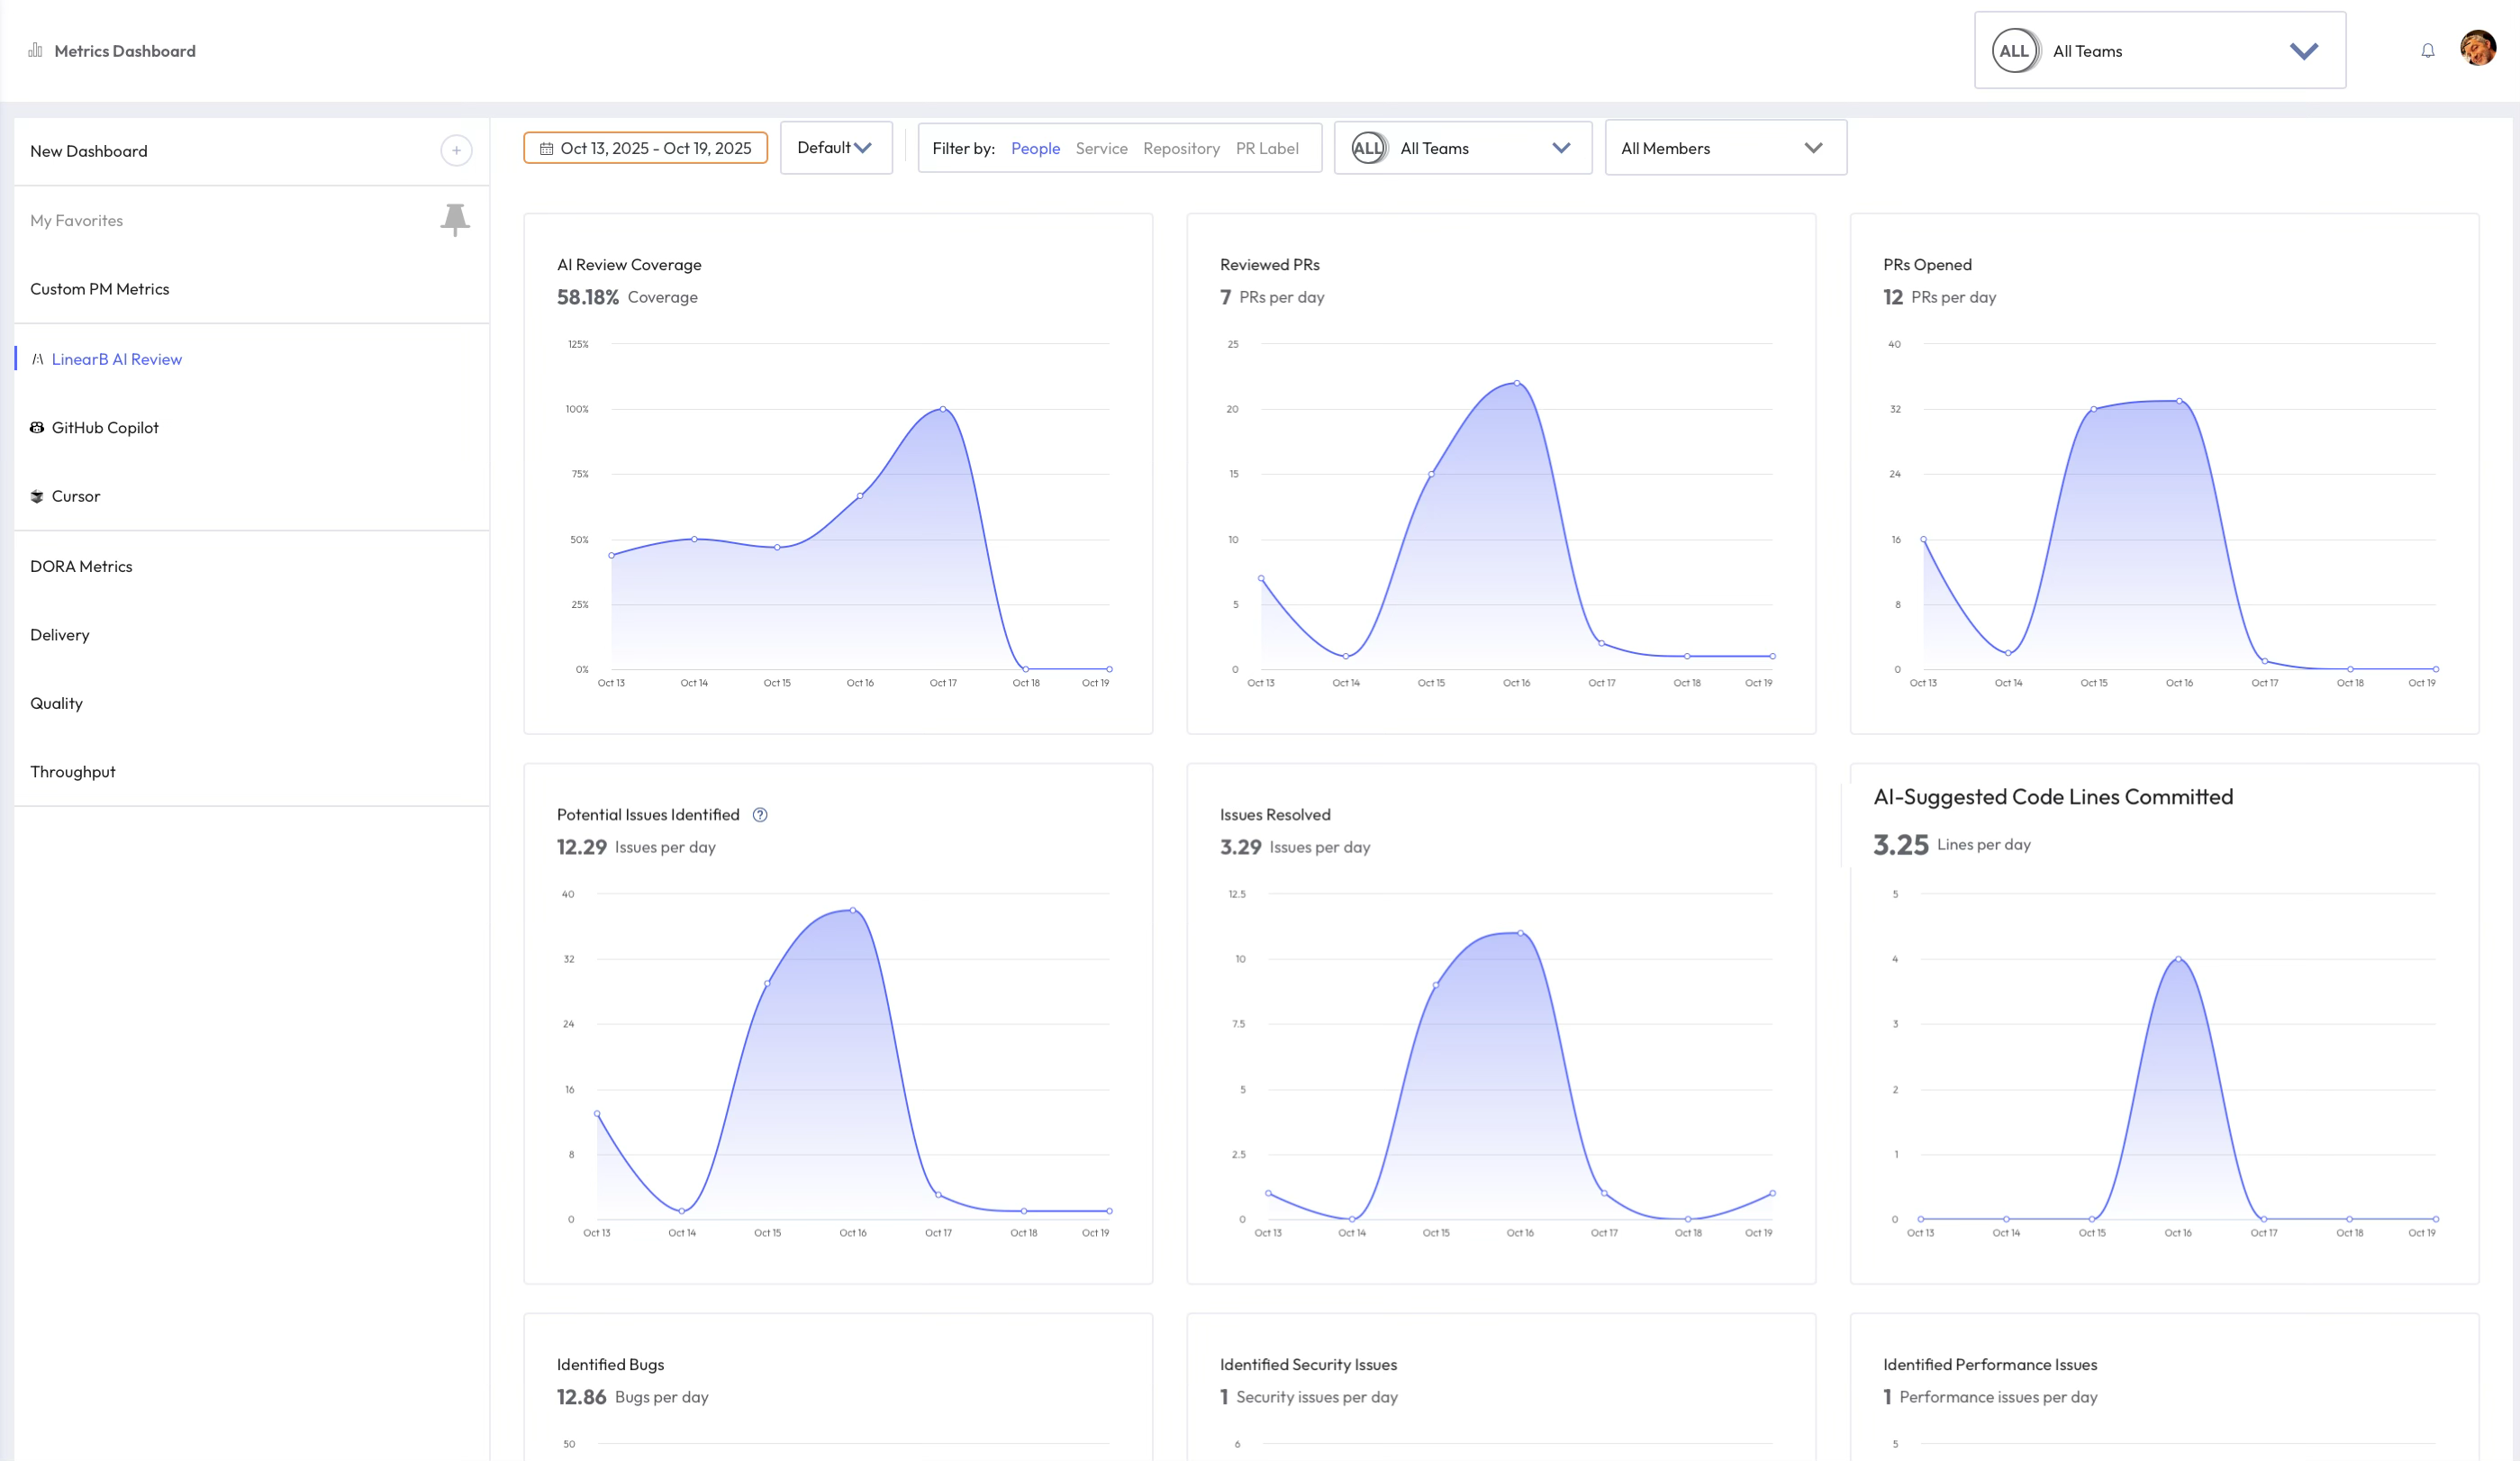
Working with trends and drill downs
AI Review metrics help you identify trends in findings across AI-reviewed pull requests.
You can click any data point on a trend line to open a detailed view of the related pull requests for that day or period. The drill-down view lists affected pull requests, repositories, and issuers so you can investigate patterns and take action directly from the data.
Each finding category highlights a different aspect of code quality, helping engineering leaders and developers understand where issues are recurring and what may need attention.
You can also click the Share icon to generate a direct link to the filtered view for collaboration or documentation purposes.

AI Review metric articles
Use the links below to view dedicated documentation for each AI Review metric.
How did we do?
AI Review Coverage
AI-Suggested Code Lines Committed